Fieldtrip GB Group data collection crib guide

We thought we would put together a brief crib guide to help run data collection projects using Fieldtrip GB with a small group.  The idea is to create a form and get the group to download this to their devices, then collect data before uploading it to a central place and visualising the groups data.  This technique can be used to great effect to collect lots of data in a short period of time, or to get groups of school children to collect data on short field class exercises.

Intro
1. Navigate to Fieldtrip GB blog
2. Show the new which has some example of what can be done and the Help
3. Click the Authoring tool link and again
4. Login – you are logging into Dropbox at this point.
5. Explain the menus at the top of the page:
a. Create – create a new form
b. Record viewer – visualise/edit the data you have captured
c. Editors Gallery – some example forms
d. My Editors – a list of forms you have created

Create a new form
6. Create a Form
a. Get the group to decide what to collect (keep it simple – trees, birds, litter, building)
b. Create the form and try to use at least drop down lists, photos, range and text box
7. Save the form – this saves it to the Dropbox account that you logged in to

Download form to device
8. Get the group to start the app on their devices
9. Get them to log in to the shared Dropbox account
10. Select Download from the footer and then select Download Forms
11. You are now ready to collect data, you will find the new form in the Capture Tab (select it in the footer)

Upload data from devices to Dropbox
12. Once we have collected data, select Download tab
13. Press Upload Records – the data will now be pushed from the device to Dropbox

Visualise and export collected data
14. On a desktop/laptop – go back to the Authoring Tool
15. Select Record Viewer
16. Use the Filter Records section to select the form we have just used
17. Press Get Records – they should appear on the map
18. To view/edit the records – press Show Table above the map, you can view/edit each record
19. To export the records, you have several options:
a. GeoJSON – ideal for web mapping/coders
b. KML – Google Earth and easy to get into GIS (ArcGIS/QGIS)
c. CSV – for Excel and GIS
20. To export, select the format and press Export. The data that is exported will reflect the filter you have applied. In most cases you will be exporting all data collected using a particular form, but you could apply a date range filter if you wanted.

That’s it.  Really quite easy isn’t it.  Click here to download the guide as a PDF.

Fieldtrip GB – Mapserver 6.2 Mask Layers

By Fiona Hemsley-Flint (GIS Engineer)

Whilst developing the background mapping for the Fieldtrip GB App, it became clear that there was going to have to be some cartographic compromises between urban and rural areas at larger scales; Since we were restricted to using OS Open products, we had a choice between Streetview and Vector Map District (VMD) – Streetview works nicely in urban environments, but not so much in rural areas, where VMD works best  (with the addition of some nice EDINA–crafted relief mapping) . This contrast can be seen in images below.

streetview1VectorMapDistrict1

Streetview (L) and Vector Map District (R) maps in an urban area.

streetview2VectorMapDistrict2

Streetview (L) and Vector Map District (R) maps in a rural area.

In an off-the-cuff comment, Ben set me a challenge – “It would be good if we could have the Streetview maps in urban areas, and VMD maps in rural areas “.

I laughed.

Since these products are continuous over the whole of the country, I didn’t see how we could have two different maps showing at the same time.

Then, because I like a challenge, I thought about it some more and found that the newer versions of MapServer (from 6.2) support something called “Mask Layersâ€�  – where one layer is only displayed in places where it intersects another layer.

I realised if I could define something that constitutes an ‘Urban’ area, then I could create a mask layer of these, which could then be used to only display the Streetview mapping in those areas, and all other areas could display a different map – in this case Vector Map District (we used the beta product although are currently updating to the latest version).

I used the Strategi ‘Large Urban Areas’ classification as my means of defining an ‘Urban’ area – with a buffer to take into account suburbia and differences in scale between Strategi and Streetview products.

The resulting set of layers (simplified!) looks a bit like this:

masking example

Using Mask layers in MapServer 6.2 to display only certain parts of a raster image.

Although this doesn’t necessarily look very pretty in the borders between the two products, I feel that the overall result meets the challenge – in urban areas it is now possible to view street names and building details, and in rural areas, contours and other topographic features are more visible. This hopefully provides a flexibility  for users on different types of field trips to successfully implement the background mapping.

Here’s a snippet of the mapfile showing the implementation of the masking, in case you’re really keen…

#VMD_layer(s) defined before mask

LAYER

…..

END

#Streetview mask layer

LAYER

NAME “Streetview_Mask”

METADATA

…..

END

#Data comes from a shapefile (polygons of urban areas only):

DATA “streetview_mask”

TYPE POLYGON

STATUS OFF

END

#Streetview

LAYER

NAME “Streetview”

METADATA

…..

END

#Data is a series of tiff files, location stored in a tileindex

TYPE Raster

STATUS off

TILEINDEX “streetview.shp”

TILEITEM “Location”

#*****The important bit – setting the mask for the layer*****

MASK “Streetview_Mask”

POSTLABELCACHE TRUE

END

Hacking Mapcache with ImageMagick

To generate tiles for the map stack used by FieldTrip GB we are using 4 Mapserver instances deployed to an OpenStack private cloud. This means we can get all our tiles generated relatively quickly using inexpensive commodity hardware. A problem we have is that the resulting PNG tile images look beautiful but are way too big for users to download to their mobile device in any quantity. So we looked to using Mapserver’s built in JPEG format but our cartographers were not happy with the results. One of my colleagues came up with the bright idea of using ImageMagick to compress the PNG to JPEG instead, and the result (using 75% compression) was much better. We can use the ImageMagick command line  with the following syntax:

convert_png_to_jpeg_delete_png.sh

for var in "$@"
do
echo "converting $var to jpg";
convert $var -quality 75 `echo $var | tr '.png' '.jpg'`;
# rm $var
done

and pipe this script using xargs to traverse an existing cache with the PNG generated tiles.

find . -name '*.png' -print0 |  xargs -0 -P4 ../convert_png_to_jpeg_delete_png.sh

So the cartographers finally relented and we now have much smaller files to download to devices. The only problem is that the script to run the ImageMagick convert takes for ever to run ( well all right – 2 days). It’s not because ImageMagick is slow at compression – it’s super fast. It’s just that the IO overhead involved is huge as we are iterating over  16 million inodes. So our plan of scaling up commodity hardware (4 CPU virtual machine) is failing. A solution is to do the jpeg conversion at the same time as the tile caching – this way you are only dealing with one tile at the point you are writing to the cache – so there is much less overhead.

So it’s time to hack some of the Mapcache code and get ImageMagic to add the above compression just after it writes the PNG to the cache.

This just involves editing a single source file found in the lib directory of the Mapcache source distribution  ( mapcache-master/lib/cache_disk.c ). I’m assuming below you have already downloaded and compiled Mapcache and also have downloaded ImageMagick packages including the devel package.

First of all include the ImageMagick header file

#include  <wand/magick_wand.h>

Then locate the method  _mapcache_cache_disk_set. This is the method where Mapcache actually writes the image tile to disk.

First we add some variables and an Exception macro at the top of the method.

MagickWand *m_wand = NULL ;
MagickBooleanType status;

#define ThrowWandException(wand) \
{ \
char \
*description; \
\
ExceptionType \
severity; \
\
description=MagickGetException(wand,&severity); \
(void) fprintf(stderr,”%s %s %lu %s\n”,GetMagickModule(),description); \
description=(char *) MagickRelinquishMemory(description); \
exit(-1); \
}

Add then right at the end of the method we add the MagickWand equivalent of the convert command line shown above. The compression code is highlighted

if(ret != APR_SUCCESS) {
ctx->set_error(ctx, 500, "failed to close file %s:%s",filename, apr_strerror(ret,errmsg,120));
return; /* we could not create the file */
}

// *******ImageMagick code here ********

ctx->log(ctx, MAPCACHE_INFO, “filename for tile: %s”, filename);
MagickWandGenesis() ;
m_wand=NewMagickWand() ;
status=MagickReadImage(m_wand,filename);
if (status == MagickFalse)
ThrowWandException(m_wand);
// MagickSetImageFormat(m_wand, ‘JPG’) ;
char newfilename[200];
strcpy(newfilename, filename) ;
int blen = strlen(newfilename) ;
if(blen > 3)
{

newfilename[blen-3]=’j’ ;
newfilename[blen-2]=’p’ ;
newfilename[blen-1]=’g’ ;
MagickSetImageCompression(m_wand, JPEGCompression) ;
MagickSetCompressionQuality(m_wand, 75 ) ;
ctx->log(ctx, MAPCACHE_INFO, “filename for new image: %s”, newfilename);
MagickWriteImage(m_wand, newfilename ) ;
}
/* Clean up */
if(m_wand)m_wand = DestroyMagickWand(m_wand);
MagickWandTerminus();

And that’s it. Now just the simple matter of working how to compile it, link it etc.

After a lot of hmm’ing and ah-ha’ing (and reinstalling ImageMagick to more recent version using excellent advice from here ) it meant making the following changes to the Makefile.inc in mapcache src root dir.

INCLUDES=-I../include $(CURL_CFLAGS) $(PNG_INC) $(JPEG_INC) $(TIFF_INC) $(GEOTIFF_INC) $(APR_INC) $(APU_INC) $(PCRE_CFLAGS) $(SQLITE_INC) $(PIXMAN_INC) $(BDB_INC) $(TC_INC) -I/usr/include/ImageMagick
LIBS=$(CURL_LIBS) $(PNG_LIB) $(JPEG_LIB) $(APR_LIBS) $(APU_LIBS) $(PCRE_LIBS) $(SQLITE_LIB) -lMagickWand -lMagickCore $(PIXMAN_LIB) $(TIFF_LIB) $(GEOTIFF_LIB) $(MAPSERVER_LIB) $(BDB_LIB) $(TC_LIB)

Then run make as usual to compile Mapcache and you’re done! The listing below shows the output and difference in compression:

ls -l MyCache/00/000/000/000/000/000/
total 176
-rw-r–r–. 1 root root 4794 Jul 23 13:56 000.jpg
-rw-r–r–. 1 root root 21740 Jul 23 13:56 000.png
-rw-r–r–. 1 root root 2396 Jul 23 13:56 001.jpg
-rw-r–r–. 1 root root 9134 Jul 23 13:56 001.png
-rw-r–r–. 1 root root 8822 Jul 23 13:56 002.jpg
-rw-r–r–. 1 root root 46637 Jul 23 13:56 002.png
-rw-r–r–. 1 root root 8284 Jul 23 13:56 003.jpg
-rw-r–r–. 1 root root 45852 Jul 23 13:56 003.png
-rw-r–r–. 1 root root 755 Jul 23 13:55 004.jpg
-rw-r–r–. 1 root root 2652 Jul 23 13:55 004.png
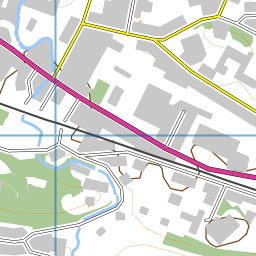
original PNG tile

converted to JPEG at 75% compression

Fieldtrip GB – A data capture app from EDINA

EDINA, the Jisc funded data centre based at the University of Edinburgh,  has just released an app that allows users to capture data against high quality base maps.  Fieldtrip GB has been designed to support teaching, learning and research in Great Britain. In summary, Fieldtrip GB:

  • is free to download and use
  • uses high quality background maps that offer rich data in both urban and rural environments
  • allows maps to be cached for off-network usage
  • enables data capture
  • includes the ability to create custom data collection forms that allow users to define the data they want to capture.

So what does it look like?

The app is split into 4 sections; Home, Maps, Capture and Download and Sync.   In addition there is a header which displays active elements such as the GPS/GPS tracking and a footer which allows quick navigation between the sections (Fig 1).

Fig 1 – Fieldtrip GB Home Screen

Quality Cartography

Part of the appeal of Fieldtrip GB is the mapping it uses.  The maps have been designed and optimised for a small screen making them ideal for viewing on a mobile phone. One of the challenges when creating the app was to ensure that the mapping worked in both urban and rural environments.  This is tricky as user will be looking for buildings, roads and road names in urban areas but users in rural areas may be more interested in features such as contour lines and rivers. Getting the highest zoom levels right was tricky but a new feature in Mapserver 6.2 allowed the developers to create an urban mask. Areas that were considered to be “urban” would display OS Street View data, whereas “rural” areas would display OS VectorMap District data augmented with OS Land-Form PANORAMA contours and path data from Natural England. In addition, considerable effort was made to place labels in sensible places, not an easy task when you need to automate the process for the whole country. Examples of the cartography are shown below (Fig 2)

Fig 2 – Examples of the mapping in Fieldtrip GB (left to right – Urban, Rural, Urban-Rural boundary)


Off-line maps

We understand that mobile data connectivity is not reliable in many areas of the country. Fieldtrip GB has been designed to allow users to download maps to their phones prior to going into the field. This way they will be available when data connectivity is not. There is the additional advantage that you can use WiFi to download the maps and not eat into your data allowance.

Capturing data doesn’t require a data connection.  You can collect data all day, or in fact all month, and then upload it all when you are able to connect to a strong WiFi signal.

Capture Data

There are two ways to capture data in Fieldtrip GB; by using one of the standard capture elements which support text, images, audio and GPS tracklog capture, or through the custom capture forms.

The custom capture forms are created through the Fieldtrip GB Authoring Tool. This is a website that allows users to design forms by dragging elements into an editor and defining the specific parameters they want to capture (Fig 3). We think this is where Fieldtrip GB really stands out as a useful research tool.  The Authoring Tool allows you to design data capture to meet your specific research aims. Custom data capture forms are uploaded to you Dropbox folder so that they can be accessed from your phone. To load them on your phone, just login and then perform a sync. This will grab any new forms from Dropbox  and save them to your phone.


Fig 3 – Overview of the Authoring Tool

Here’s an example of a form, in this case it is for collecting information about rocks (Fig 4). There is a drop down selector allow users to specify sedimentary, metamorphic or igneous rock types, sliders to record dip and strike, a note book reference and a photo capture option. Quite simple things, but easy to record and data will be consistent. We added a field-note Book ref so users could tie the digital record to their paper notes which might include specific details or a sketch.

Fig 4 – Example of a custom data capture form

Upload –> Edit –> Share

Once you have captured your data you can upload it to your Dropbox account and then either access it from there or view, edit and export it through the Authoring Tool (the authoring tool is so much more than an authoring tool).  In the authoring tool you can export the data from GPX format to other useful formats such as KML. You also have the option to share your maps with others. The Authoring Tool will mint a WMS of your data and provide you with a link embedded in your Dropbox folder, all you have to do is control who you share this link with.

What’s Next?

Well, the app is available for Android Devices and you can download it from the Google Play Store.  We have submitted it to the Apple iStore and are awaiting approval.  If all goes well this should take no more than a couple of weeks.

As for future versions and developments, we have a few features that we want to improve but what we really want is feedback from users. What would you like to see in the app?  What would you need to make this an indispensable tool for teaching and research.

 Take a look at the Fieldtrip GB website

Fieldtrip GB is live in Play Store

Fieldtrip GB is now available to download from the Google Play Store.  This is hugely exciting.  Fear not iPhone users, we haven’t forgotten about you.  We are just about ready to submit the app to the iTunes App Store and will be waiting for it to be approved. This could take up to a couple of weeks. We will let you know when it is approved and ready to download.

Fieldtrip GB is now available at Google Play