NLS publishes new 1840s-1950s Ordnance Survey detailed maps for London and South-East England

National Library of ScotlandThe National Library of Scotland has just made freely available online 16,865 historic Ordnance Survey maps covering Greater London and the south-east of England. The Ordnance Survey 25 inch to the mile (1:2,500) maps were the most detailed series covering both urban and rural areas in the 19th century, and date between the 1840s and the 1950s. The maps are immensely valuable for local history, allowing practically every feature in the landscape to be shown. They provide good detail of all buildings, streets, railways, industrial premises, parkland, farms, woodland, and rivers.

At present, coverage is of Berkshire, Buckinghamshire, Essex, Hampshire, Hertfordshire, Kent, London, Middlesex, Surrey and Sussex. The scanning of this series is underway and will expand geographically over the next couple of years.

NLS has also georeferenced a layer of these maps dating between the 1890s-1920s, allowing them to be compared directly to modern day maps and satellite images with a transparency slider, as well as compared side by side on screen.

NLS OS 25 inch London side by side

New detailed online maps covering post-War Edinburgh and London

Tony and I were contacted yesterday by our colleague Chris Fleet, Senior Map Curator at the National Library of Scotland with the exciting news that NLS have made freely available their earliest editions of Ordnance Survey National Grid maps at 1:1250 scale covering Edinburgh and London.  These were Ordnance Survey’s most detailed maps in the 20th century, and they show nearly all permanent features of over 1 square metre in size. They show excellent detail of commercial and residential buildings, railway stations, pubs, hotels, docks, factories and parks, as well as house names and numbers.

The maps can be viewed as a georeferenced overlay and as a dual-map / side-by-side viewer, allowing direct comparison with modern Google or Bing maps:

Edinburgh   georeferenced overlay    side-by-side viewer

London         georeferenced overlay    side-by-side viewer

Chris tells us this mapping layer will expand geographically over the next year as NLS continue to scan more OS National Grid post-War mapping.  To whet your appetite we’ve added a few sample London maps below.

King's Cross and St Pancras Stations

King’s Cross and St Pancras Stations

Isle of Dogs docks

Isle of Dogs docks

South Bank Festival of Britain site

South Bank Festival of Britain site

Chris would love you to come and visit the NLS site and browse through these fantastic 1940s-1960s maps for Edinburgh and London.

Digimap for Schools adds historic map layer

DFS

Old and new

Digimap for Schools has added a new historic map layer to the popular online map service, extending its potential for use in schools across a wider spectrum of the national curriculum.

The new historic map layer features mapping from the 1890s and covers the whole of Great Britain. Teachers and pupils will be able to overlay the historic maps over current mapping and compare changes in the landscape in their areas and beyond.

Digimap for Schools is an online application developed by EDINA at the University of Edinburgh. It gives schools easy access to a wide range of Ordnance Survey mapping using a simple login and password. The service is available to all pupils regardless of age. It allows schools to access a variety of mapping scales including Ordnance Survey’s most detailed OS MasterMap and the famous OS Explorer mapping at 1:25,000 scale which is ideal for outdoor activity.

The historic Ordnance Survey maps have been scanned and geo-referenced by the National Library of Scotland (NLS)and made available in Digimap for Schools. The maps were originally published between 1895 and 1899 as the Revised New Series in England and Wales and the 2nd Edition in Scotland. The historic maps are high quality scans at 400dpi for Scotland and 600dpi for England and Wales. This means that they can be enlarged far beyond their original scale of 1 inch to 1 mile.
OSElaine Owen, Education Manager at Ordnance Survey, added: “This new layer in Digimap for Schools is a fantastic resource for teachers and pupils of all ages, especially if they’re working on a local history project. The historic layer is viewable against a range of modern map scales up to 1:10,000 scale. You can access the maps via a slider bar that allows the contemporary map to be gradually faded away to reveal the historic map. We’ are adding some new history and geography resources to accompany the layer, including looking at how coastlines have changed over the last 120 years.�
Pupils and teachers using Digimap for Schools can save and print maps at A4 and A3 size. The maps can be printed as a historical map, or combined with the modern map at different transparency settings as a merged image. The full set of annotation tools are available for use on the historic map, providing many opportunities to highlight changes.
Since Digimap for Schools launched in 2010, the service has been adopted by over 20% of secondary schools. 
NLSChris Fleet, Senior Map Curator at NLS said “Old maps present our history in one of its most enthralling forms. We are delighted to be collaborating with Ordnance Survey and EDINA in delivering our historic maps to schools through the Digimap for Schools application.�
Peter Burnhill, Director of EDINA at the University of Edinburgh said “Students, pupils and their teachers now have unrivalled access to the very best maps to gain rich understanding of how Britain’s landscape has changed in over a century. The result is endlessly fascinating, the skill and generosity of staff at the National Library of Scotland have enabled a real sense of place when combined with the Ordnance Survey maps of today’s Britain.�

Digimap for Schools is open to all schools in Great Britain via an annual subscription. The subscription costs £69 for a primary school and up to £144 for a secondary school.

Creating a transparent overlay map with mapbox-ios-sdk

For this blog post i have managed to capture on of EDINA’s mobile developers.  Their guest article will describe how to create transparent overlays for mobiles using mapbox-ios-sdk.

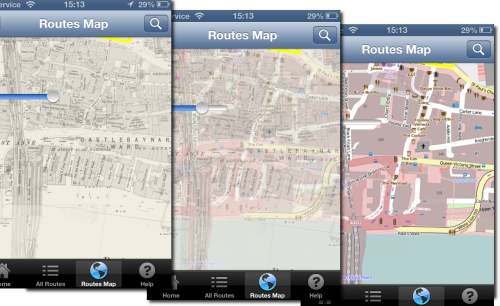
I am working on a historic map overlay, where the user can adjust the transparency of the historic map. The user can then see the how the land use has changed over time by using the slider.

opacity-map-overlay

I am going to use the map-box fork of route me. Looks like a good bug fixed version of Route-me and map-box do seem to have great some great products.

Unfortunately it doesn’t have an have an API to dynamically change the opacity of a tile source out the box. So I added it.

Its pretty easy to add. Each tileSource has a RMMapTileLayerView container when added to the map. Within that can manipulate the CALayer.opacity to get the desired effect.

I added a fork to github for testing

https://github.com/murrayk/mapbox-ios-sdk/

And example of use – the code is in github. Do a ‘git clone –recursive’ to install the submodules.

https://github.com/murrayk/mapbox-overlay-opacity-example

And example of use. In the  main view controller.

- (void)viewDidLoad
{
    [super viewDidLoad];
        // Do any additional setup after loading the view, typically from a nib.
    RMOpenStreetMapSource * openStreetMap = [[RMOpenStreetMapSource alloc] init];
    RMGenericMapSource * weatherMap = [[RMGenericMapSource alloc] initWithHost:@"tile.openweathermap.org/map/clouds" tileCacheKey:@"cloudCover" minZoom:0 maxZoom:18];

    self.mapView.tileSource = openStreetMap;

    [self.mapView addTileSource:weatherMap];

    self.overlay = weatherMap;
    // rough bb W = -30.0 degrees; E = 50.0 degrees; S = +35.0 degrees; N = +70.0 degrees
    NSLog(@"zooming to europe");
    CLLocationCoordinate2D northEastEurope = CLLocationCoordinate2DMake(70,-30);
    CLLocationCoordinate2D southWestEurope= CLLocationCoordinate2DMake(35,50);
    [self.mapView zoomWithLatitudeLongitudeBoundsSouthWest:southWestEurope northEast:northEastEurope animated:YES];

    [self.mapView setOpacity:0.5 forTileSource: self.overlay];

}

//hook up a slider to manipulate the opacity.  

- (IBAction)changeOverlayOpacity:(UISlider *)sender {

    NSLog(@"Slider value changed %f", sender.value );
    [self.mapView setOpacity:sender.value forTileSource: self.overlay];
}
If you found this blog useful, you might want to look through the archived articles on EDINA’s developers Geo-Mobile blog


Digimap 2012-13 Print Maps & Data worth nearly £40 Million

Money and Calculator

Picture courtesy of Images_Of_Money

As part of our work to demonstrate the impact of Digimap, EDINA has calculated the commercial value of all the data downloaded and maps created for printing. We calculated the values per institution for the period August 2012 to May 2013 then totalled them; this came to approximately £39 .5 million.  This estimate is a conservative one as we reduce the quantity of data downloaded by 60% to account for duplication. When all the maps printed and data downloaded were included in the calculation (i.e assuming users would continue to take their own data and maps, and not share them) the value rises to nearly £71 million.

Digimap Data and Print map values from 2010 to 2013

Click to enlarge image.

We know that some data is downloaded multiple times within an institution, for example by the students in a class exercise or for specific study sites. We found that only 40% of the data taken from Digimap over a period of time was unique to an average institution. We believe that if institutions were paying commercial rates for their data it would be more likely that they would try to download it once and then circulate it to those who need it; for this reason the value calculations only include 40% of the total. However, there is considerable variation between institutions as to how much is unique; those that do more research or are smaller in size tend to have a greater proportion of unique downloads, so we have included the 100% figure as a ceiling value.

In total, over the past three academic years over £190 million (£100 million at 40%) worth of print maps and data has been served up from Digimap to subscribing institutions.

How the Costs are Calculated

Porportions of Digimap Collections Values

Click to enlarge image.

The costs used in our calculations for the data downloaded come from the data suppliers, and include any relevant multipliers or discounts made publicly available on their websites.

The data values are calculated on a per product / per institution basis, with the data preparation and licensing charges assigned only once per product, per institution. Many of the data collections are licensed based on the number of users who have access to the data; with increasing numbers of users a multiplier is applied to a base cost.  We applied the relevant multipliers based on the number of active registered users for each collection at an institution. SeaZone data is provided commercially through a third party website; we picked the closest match possible to the data we provide though this does have a lower cost, again making the estimates conservative.

We capped data values at the price it would cost to take national coverage of each product, making it impossible to charge more for any one product than it would to supply the entire dataset for use by the whole institution.

The values for the print maps (including saved images in Carto and Ancient Roam) are calculated by finding the cheapest available commercial map prints from websites such as eMapsite, NLS and FiND. These values are updated every time we calculate the values.

What We Didn’t Include

Digimap Screen Maps Made 2010 to 2013

Click to enlarge image.

No monetary values were assigned to the millions of screen maps that are produced from Digimap; we couldn’t find a comparable site! Also, the value calculated doesn’t take into account any of the support materials, training courses and help desk facilities that are all part of the Digimap service.

No OpenData downloads or maps created from OpenData are included in the calculation, despite the advantages of producing them from Digimap over other websites.

However the biggest saving that isn’t included in these value calculations is your time. We only charged the data supplier’s preparation and licensing costs once per product or order, in line with each companies policy. In reality there would be many orders occurring throughout an academic year as new research questions are raised. This all costs time, time which the data suppliers will charge for or that institutional staff would have to take to put in requests for data or to create and manage a repository for spatial data.

Digimap does all this work for its subscribers along with providing a high quality mapping interface, 24 hour access to expensive high quality data and maps.

Over the coming weeks we will be sending out each institution’s values to Digimap site representatives. If you are interested in the value of the maps and data your institution has been using then get in touch with them.  If you are unsure who your site representative is then please contact us:

  • email: edina@ed.ac.uk
  • phone: 0131 650 3302

EmailShare

Geoforum 2013


Geoforum 2013

Geoforum 2013

EDINA had a day out in London running it’s Geoforum event. Geoforum aims to bring together Digimap Site reps from subscribing institutions around the country and showcase some of the new functionality in EDINA’s geoservices. It also gives site reps an opportunity to ask questions to the Digimap team and to chat with other reps about how information about, and support for, services is provided. There was a live blog running throughout the day which is well worth a read if you did not manage to attend the event. Links to videos and slideshare will be added as soon as they are available. The keynote speaker was delivered by Shelley Mosco of The University of Greenwich.  Shelley is a member of the The School of Architecture, Design and Constructionand  described the ways in which spatial data could be used to inform design. Shelly was keen to mention the importance of spatial data and GIS in the implementation of Building Information Models (BIMs).  BIMs have been used in large engineering projects for some time, however the government is making them mandatory for all publicly funded building projects in England and Wales. This means that commercial organisations will be looking for students to have been trained in the concept of BIMs and the software that drives them.  You can find out more about BIMs through the following links:

Geofurum 2013 keynote

Geofurum 2013 keynote

Shelley then handed over to two of her current MSc students who gave brief overviews of their experiences of learning about GIS and using spatial data in their projects.  Both David Parfitt and Rob Park were self-confessed GIS newbies, but they managed to get data from Digimap and use it in their conservation projects. The data allowed them to visualise and analyse the environment and provide evidence to support their proposed designs.  Their demo’s were excellent and really showed the power of simple GIS analysis.

You can view the slides from this presentation here:

Shelley_Geoforum

Digimap Data and a non-traditionalist approach – Shelley Mosco

Next up was a presentation that focused on Open Source Resources for Geospatial. The presentation looked at data, software and web-mapping. The main resources are listed below:

Data

  • OS Open data is available through the Digimap Data Download service.
  • ShareGeo Open is a repository for open geospatial data. It has lots of useful and interesting datasets on a variety of subjects such as wind farms, crime, boundaries and DTMs
  • Data.gov.uk – the uK government’s open data store

Software

  • QGIS – one of the best open source GIS out there. Lots of functionality and plugins that allow you to perform complex spatial analysis. It is also well supported by forums.
  • gvSIG – anther fully functioning GIS.
  • GRASS – a remote sensing package aimed at serious remote sensor’s. If you are a newbie to remote sensing, you can access GRASS tool through the GRASS plugin for QGIS which makes things really simple.

Web-mapping

Digimap is a great web mapping tool, but how can you create your own interactive web map for your website?

  • MapBox – simple intuitive web site that helps users build interactive web maps. Basic functionality is free, more advanced functions are available for a small fee.
  • Leaflet – the engine behind MapBox, it is free but requires user to do a “bit” of programing
  • Openlayers – an alternative to Leaflet which is more flexible. Openlayers powers Digimap. Requires a fair amount of programming knowledge.
  • MapServer – implements Openlayers for enterprise scale operations. MapServer is also used for Digimap services.
OpenSource

Open and “Free” Geo Software & Data – slideshare

Fieldtrip GB – data capture, simplified
Fieldtrip GB is a data capture app from EDINA. It simplifies the process of capturing data in the field against quality cartographic mapping. It is equally at home in urban environments as it is in rural ones. Custom forms allow users to design their own data capture projects and collect exactly what they need for their research.  The session gave a brief overview before running a “live” group data collection exercise.  A custom form was created and deployed to participants mobile phones. They then headed outside and captured data on things like building fabric and design.  After 15 mins everyone reconvened and the collected data was “synced” and exported to Google Earth.
You can view the slides from this presentation on slideshare:
FtGB Slideshare

FtGB Slideshare

FieldtripGB – data capture simplified from Addy Pope

As mentioned earlier, there is a transcript from a live blog (how on earth can anyone type so fast!!), so if you didn’t manage to attend and want to find out what happened please check it out.


Old Maps online workshop

Old maps online launched some months back and has been quite a hit.  It essentially is a catalogue of old maps from library collections around the World.  However, it is much more than just that. Old maps online allows users to make spatial searches for maps rather than having to rely on fields such as Title, author and published date.  This is not the information that springs to mind when you want a map.  Place-names, regions and coordinates are more logical search terms.

As part of the Old Maps Online project, the  team are putting on workshops and i attended the Edinburgh event on Thursday 13th December. Edinburgh is steeped in mapping history and has one of the largest map library collections in the World.  Whats more, a significant percentage of the National Library of Scotland’s collection has been scanned and made available online for free.  The NLS have recently updated their catalogue interface and it is even easier to search and view maps.  This is a huge resource and has sparked the interest in many researchers who have utalised the old maps in their research.

The NLS site is uses software from Klokan Technologies, a small Swiss company run by Petr Pridal. Petr has put a lot of effort into improving the searching and discovery of historic maps online and it was for this contribution that he received the Bartholomew’s Globe. The Bartholomew’s Globe is an award from the Royal Scottish Geographical Society (RSGS) and is awarded in recognition of an exceptional contribution to cartography, mapping and related techniques in Scotland over a long period of years. The award was presented by Bruce Gittings, RSGS Vice Chairman.

Bartholomew’s Award 2012

The rest of the event focused on how historic maps, and historic geographical data in general, were being used in researchers. The flavor was, as expected given the location, generally Scottish, but it also brought together a mix of academic researchers, commercial organisations and enthusiastic amateurs.  Presentations that stood out included:

Alice Heywood (NLS) who described a project that got School children to develop content for mobile apps that provided historic tours of their home towns. The pilot had been run in Elgin and the children had produced some excellent narratives explaining their local historical sites and traditions.  This kind of partnership between the NLS and schools seems like an excellent initiative. Perhaps it could link in with organisations such as VisitScotland to create apps for tourists visiting Scotland. More information about the Great Escapes project can be found on the NLS website.

Chris Speed (University of Edinburgh) who discussed the “blue dot” concept.  This is really that a mobile device will represent your position as a blue dot, but using historic maps and data you can allow the user to travel back through time at a particular location. Chris has had publicity with his Walking through time app, a project which was supported by JISC and EDINA. This allowed users to view historic maps of Edinburgh and embark on guided tours through history via their mobile phones. Chris want to expand this to Glasgow, arguably a more dynamic environment which might reveal more startling change to users. I am not sure I entirely agree with Chris’ comments about connecting with individual objects such as trees which have persisted in green spaces while the build environment has changed around them.  Trees on maps tn to be representative rather than an absolute record.  However, if you are in a greenspace and faced by a tree that is clearly over 100 years old and trees are marked on the map you can believe that the surveyor stood there and added it to the map all those years ago and that tree is a link to the past environment.

There were 2 talks on mapping old transport links.  David Simpson had tried to locate roads marked on Roy’s Maps, Roy’s Roads. David found that bridges were quite reliable features of Roy’s maps and by locating these on the ground and modern maps you could then find the old road features. Many of these bridges are being lost, used only by farmers to access fields but represent an important part of Scotland’s history.  Neil Ramsay (Scotways) was working to display old path networks on modern maps.  Discovering old routes and posting them online is one way in which Scotways in encouraging people to get out and discover their local area. It was noted by a member of the audience that there was an apparent lack of paths connecting Glasgow and Edinburgh. Neil noted this and mentioned that it was certainly on the list of places to investigate, perhaps enthusiastic walkers could lend a hand.  Just go to the NLS maps page and scan through the maps to see if a path exists in your local area that is missing from the modern OS maps, then get out an see if it exists on the ground. Take a look at Scotways excellent Heritage Paths site.

There was a very interesting presentation on using Historic maps as a tool for place-name research given by Jake King (Ainmean Aite na h-Alba). Jake had used the NLS historic maps to investigate the changes in spelling of Gaelic place-names through time.

Bomb Sight

Bomb Sight

Humphrey Southall and Andrew James (The National Archives) deputised for Kate (bomber) Jones (University of Portsmouth) who was unable to travel to the event.  The Bomb Sight project maps the bombs that fell on London during the first phase of the blitz. This project digitised and mapped records held by the National Archive. These maps were previously only available for the public to view in the reading room at the National Archive.  Users can view the location of bombs and display attribute data such as the date, bomb type and, in most cases, view “nearby memories” such as audio and pictures from the archive. Users can switch between the modern map and the 1940 Bomb maps. These maps are a bit grainy and it would be great to see some crisper historic mapping in there.  The Bomb Sight project also has a mobile app that allows users an augmented reality view of the blitz. The project has done incredibly well and attracted a lot of publicity. This demonstrates the power of fusing historic maps with archived data that has never been displayed digitally.

This really summed up the event.  There is public interest in historic data and making it accessible in a digital format is the key.  Once those interested in historic data can get their hands on the digital data, they can turn it into useful information that others can enjoy or even re-appoint for other uses such as education and tourism.


Maps from behind the curtain

Maps are great, I could spend hours looking at them.  It makes no difference if it is a map of somewhere I know well, or a place I don’t know at all.  Cartographic styles vary around the World and it is interesting to be able to explore maps that are in foreign languages or even different alphabets.

Russian Map of Newcastle area

There is a great site that displays Russian maps.  You can view and download the maps and are primarily old Russian Army Maps.  They are fantastically detailed given that they are not created by the national mapping agency of the country they represent.  In fact, the old maps (1950-60′s) of the UK will show military facilities that were deliberately omitted from the map by the Ordnance Survey.  Makes you wonder how they collected the base data doesn’t it.  OK, they would have aerial images, but there would need to be some ground-truthing data.  One thing that I would like to see added to the metadata that accompanies each sheet, is the date the sheet was published.

Anyway, take a look at the site and download maps that interest you.  Not a bad way to spend a cold, dark evening in my opinion.  But then, i am a bit of a map geek.

 Links to historic map viewers

Maps of the World – old maps, mainly military

NLS Maps – archive of old maps brought to you by the National Library of Scotland (GB focus)

Old Maps Online – an expanding archive of historic maps from around the World.