Will’s World at Culture Hack Scotland

This weekend saw the Culture Hack Scotland event take place at SocietyM in Glasgow. Culture Hack Scotland gathers creative people including developers, designers, artists and creative practitioners and supports them to work together over an inspiring and intense 24 hour period of idea sharing, data hacking and creativity.

The materials we have been scoping for the Will’s World registry seemed like a fantastic potential data source for this event, particularly given that it was taking place in the week of the 448th anniversary of Shakespeare’s birth.  We got in touch with the CHS team and after a bit of discussion about what might be appealing to CHS developers and what could be delivered in the time available, it was decided that we would be an official Data Partner for Culture Hack Scotland 2012 providing a marked up version of Macbeth. This would be the full text provided in XML and included various valuable additions to the data that would enable a greater array of possibilities for creative use of the text and/or aggregation with further resources.

Is this a data set I see before me?

Around a week before the event we were able to provide a link to a new data page containing the full text of Macbeth which had been beautifully marked up, including details on characters and locations (including lat/longs added through Unlock), prepared by our software engineer, Neil Mayo. Our colleagues from the Statistical Accounts of Scotland and JISC MediaHub services also made their metadata available (linked from the same page) to enable CHS participants to connect the play to related resources such as historical notes on counties mentioned in the text, or video recordings of key performances.

We sent off the data and it was featured in the weekly update for announcing data provided for the event. There were four of these Data Thursdays in all offering a staged announcement of all of the CHS data, each one announced with the release of data slices enabling developers to have a look and a play with the data ahead of the event. The last Data Thursday included a fantastic mention for the Macbeth data and, as it went live, all of us in the Will’s World team took a deep breath and nervously crossed our fingers that someone would be taking a look, having ideas, and, hopefully building something fantastic…

Who comes here?

Friday evening saw the kick off the event and the gathering of around 100 people including developers of all types, designers, artists, musicians and data owners for the kick off of Culture Hack Scotland.  The event opened with an introduction from the Culture Hack Team and an inspiring pair of talks from James Stewart, Technical Architect for data.gov.uk and Brigitta Zics, Head of Digital Media / Convenor of Creative Digital Practice Group for Culture Lab at Newcastle University.

As the evening continued all hack participants were encouraged to share any early ideas they might have to get conversations going and teams forming, and we were delighted to hear at least one possible Macbeth project emerging right away. As the event moved into the team formation and hacking time it became clear that several projects were really excited about the idea of working with the Macbeth data. A number of developers who were looking at working with Macbeth complemented the quality of the XML we had provided for CHS making us ever so proud and extra excited about the possibilities for using this data.

The night has been unruly where we lay

The true business of hacking only really kicked off late in the evening but by midnight a hardcore team of hackers were working, in teams or alone, on a range fascinating ideas and projects. At the 2.30am catch up – a meeting with a lot of coffee and around 30 committed CHS hackers – it became clear that some really creative work was underway: one team had taken a pair of old skinny jeans and were in the process of using Arduino hardware to create a very alternative way to experience The Skinny magazine’s arts listsings; a mobile developer was creating a new interface for Glasgow Museum’s Zoology collections data; one team had already finished a map interface for crowdsourced stories. However for the Will’s World team the most exciting thing was finding out about three projects who had decided to work with the Macbeth data in very different ways: one focusing on the emotions of the text; one building an interactive game; and one looking at how Macbeth and social media could be combines. Indeed Nicola Osborne, who was along at the hack representing Will’s World and EDINA, had gotten involved in one of these projects by creating some Monty Python-esque illustrations for the interactive game team.

Illustrations of characters from SketchyApp

CHS participants carried on working through the night, sustained by never ending supplies of coffee, chocolate and fruit. A few naps were taken but by early Saturday morning – when this CHS piece featuring the Macbeth data appeared in The Herald – even more teams were working away as those who could not make the Friday began to appear, full teams gathered after sleeping in shifts, and the final push to finish off ideas and hacks got under way.  The submission deadline for hacks was 4pm ready for a show and tell session of epic proportions with some 29 presentations of over 35 hacks waiting to be showed off.

CHS article in Saturday 28th April's Herald Newspaper

When shall we three meet again

In the end a total of three teams had worked with the Macbeth XML. They were:

Shakey App

Shakey App is a Massively Multiplayer, RealTime, Macbeth Parlour game. It was designed by the team of Rory Fitzpatrick (@roryf), James Newbery (@froots101), Philip Roberts (@phillip_roberts) & Padmini Ray-Murray (@praymurray). With additional stage design, by Duich McKay and character illustrations by Nicola Osborne.

Shaky App as demonstrated in their Show & Tell Presentation

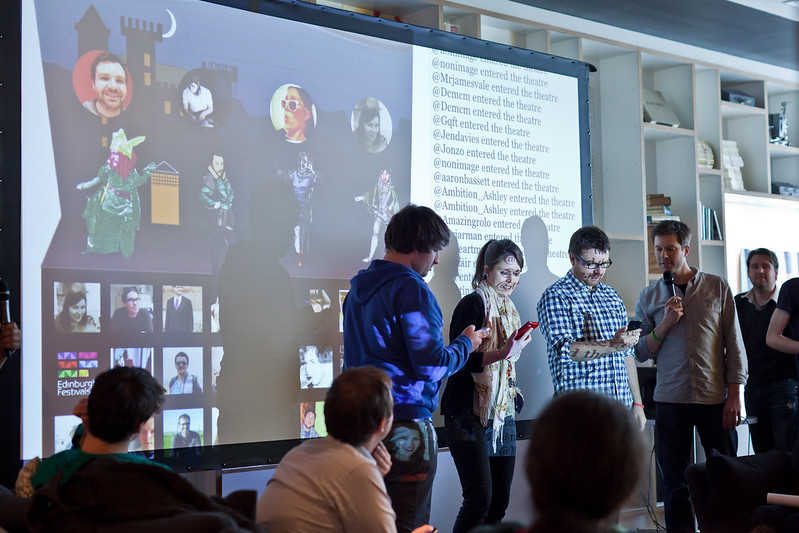
The way that Shakey App works is that players login and randomly assigned a part to play. They are then prompted with the lines via their phones and the audience around them (who also have to be logged in) can then vote on the best and worst performances by virtually hurling tomatoes in horror or throwing flowers in appreciation. It was demoed live at CHS as pictured above and you can read a full write-up  or take a look at the code for the project.

Screenshot from ShakyApp

Colouring Macbeth In a Glass Case Of Emotion 

Douglas Greenshields (@bedroomation) created this inventive exploration of the Macbeth text through the emotions of the text. The user is presented with a number of extracts from the play and asked about the one that feels most… something… that might be “fearful” or “angry” or “loving”, etc. Each of those emotion questions is coloured a certain way, fear might be green for instance. When you click on the extract that is the most of that emotion the text is coloured appropriately and over time the system builds up an idea of which scenes connect emotionally, how the readers emotion is reflected in their marking up of the text, etc. Click through to the Colouring Macbeth In a Glass Case of Emotion site to have a go and read Douglas’ account of what he has created to find out more.

Macbeth Digital 

The team of Marius Ciocanel (@MariusCiocanel), David MacKenzie and Minka Stoyanova decided to create their own Twitter client pulling in the Macbeth text as tweets from each of the characters. “Tweets” are timed to come in at a great reading pace and you can use buttons at the top of the page to switch between scenes.

Screenshot from Macbeth Digital

Screenshot from Macbeth Digital


These projects gave us some fantastic opportunity to think about some really creative uses for Shakespeare data and metadata and we were pleased that colleagues from the Royal Shakespeare Company, who are currently running the incredible World Shakespeare Festival 2012, had also been able to make it to the CHS Show & Tell and see these projects showcased.

We were inspired not only by the Macbeth projects but also by the other hacks showcased at CHS as there were some fantastic ideas from music made from footfall data to ambitious games built from poetry – full details of all of the projects created at the event are now available on the Culture Hack Scotland site.  Chatting with developers and designers throughout the event and at the Show and Tell highlighted some really useful reflections and comments around the need for quality data and the opportunities and challenges of aggregating large data sets. We will certainly be bearing in mind those perspectives as we move forwards.

Is that my prize?

Once all of the projects had presented at the Show & Tell the judging took place. We are delighted to say that Shakey App, built on the Will’s World Macbeth data, was awarded the honour of Most Playful Hack and went on to take the Overall Grand Prize Winner!

The team behind the Grand Prize Winner Shakey App.

The team behind the Grand Prize Winner Shakey App.

When the hurlyburly’s done 

Now that Culture Hack Scotland has been and gone what happens next?

Well we plan to keep the Macbeth XML available and would love to see any new ways to hack/use/create things from any of the data we made available from CHS. The page will remain live and we will be adding some additional data that complements the Macbeth XML shortly. If you do decide to create something new we would love to hear about it – leave a comment here or drop us an email us via edina@ed.ac.uk.

Culture Hack Scotland cup cake


Share

Culture Hack Scotland 2012 Show & Tell Liveblog

There’s been a bit of a gap in my liveblogging from CHS 2012. I’ll fill in the gaps in my previous posts soon. But I wanted to share the hacks here so I’ll be liveblogging the hacks as they are shown. It’s all very exciting…

But first, now that we’ve all submitted our hacks, it’s time for a performance by Jonnie Common. And he’s been up 24+ hours playing with archive sound – field recordings from the National Museum of Scotland, Alumni data from Glasgow School of Art, Tramway Footfall Data and Tapestry design data. And it’s pretty cool. Also previewing some tracks from his new album made entirely with noises from his kitchen, including his “Ofen” (apparently all automated call centres think that sounds like “beer cooler”). A really lovely piece of music generated from a base sound of kitchen. And his big finish is a piece made from Tramway footfall data.

Erin and Devon are introducing the Show & Tell with their highlights. Devon says he’s been overwhelmed by the quality of the hacks. The two main things that do it for me are the quality of the hacks – people have actually made some super sophisticated thing, and other thing that amazed me was how many people stayed up the whole night. There were like 30 people at our 2.30am check in! That’s really really special. Thank you to everyone!

James Stewart of Data.gov.uk, Birghitta Zichs researcher at CultureLab, Cath Mainland Chief Exec of the Edinburgh Fringe and Clive, Director of Dundee Contemporary Arts are our judges.

My GI

We’ve been working on two projects – My GI and Uncreative Scotland, exploring the least creative areas of Scotland. We ran out of time for the latter but we could see that project trigger funding etc. The idea is to open up the programming information – curate your own GI by logging in and creating a programme of events with own openings and talks. Break down the hierarchy of the events, ask people to your lag as part of this.

404 Visual

I came here with Interface 3 but did a little sidpromo jet with archive NMS sounds. Basically it’s an audio visual visualiser with several settings. That’s about it.

Yaunne siesnik @amazingrolo

This is a hardware hack. And I also used the NMS field recordings here as I’m a huge fan of field recordings. And I’m really interested in usual ideation of sound, but also the physical inout and output of sound. So this is an output device for sound as lights, using pitch tracking to control the lights. I also hurt my hand recently and this led to me thinking about ways people with limited mobility experience sound. Also sound is hard o do in a public space – too loud and annoying or awkward and problematic. And what.  If you can’t hear the sound at all? So I made a bit of software here.

Team 365

Wanted something different. Combined skinny and list data and used sound data to make a soundscape of events. So this is Glasgow tonight. Uses sound cloud data.

Team shaky

Before we get set up we want as many people as possible on twitter/iPads. Massive game. You get a role, you perform, veg or flowers are thrown.

Kyle

I am a student at Glasgow Uni and I worked on a visualisation of the tramway hourly footfall data. Both by hour and by exhibition.

Team banned by google

We didn’t have an idea until late last night, we worked with the creative Scotland data set and data visualisation, we’ve used postcodes and built boundaries and then visualised the amount of spending. We got banned by google or hitting their servers too hard, hence the name.

A short gap so Rohan gives us a thought experiment – imagine the cost of this talent for this many hours!

Douglas

I wanted to do something and Macbeth was a really huge data set and huge amounts of content. It shows a random text, asks you a question about the emotion and then colour codes the text. It builds up the colours over time and responds to the emotion of the reader

Stef & Carolyn

Scottish book trust my favourite place data was something I was looking at on the way to CHS. It’s a lovely idea but it doesn’t look that exciting, it felt like they forgot about the story. So we built storyline using a tile set called stamen o build a painting like map o he stories. We finished at midnight so…

Another hack. Cuts mean artists are not as well supported so this is the idea of communally funding artist time on experimental time. You put money in to fund artists to work for a number of days a month. ? Time and people is the issue for me as part of an arts organisation so the idea here is to give people time for their work.

Jen and paulo

Paulo: This is a hack using chapter titles and the text of the track an novel by Catriona childs. The chapters are named after song titles so you can also lck through to that track. You can also click away, explore other parts of the book. Uses refreshed random images from instagram.

Jen: and we built a second hack to see what’s oing on an hidden where you currently are so you can explore what has been contributed in your area (eg data like “this I the pub from train spotting” )

Macbeth digital

Thought that it would be great to see plays on twitter, a twitter client that runs through the whole of Macbeth, you can see it come in every second or two and skip between scenes

Temas

Field recording hero! This was based on national museum of Scotland. Takes lips automatically, can speed it up. Can increase density. Can also combine some sounds. You can click or play via the keyboard. And you can make your own field recordings

Jim, donny, carol – yarn spinner

This is an easy beautiful and social way o read on a tablet. Swiping sucks. The first book here is Catriona child’s book trackman. It pulls in bits of text and associated images added to the book,can favourite bits of the book, can comment so v good in education, can send to twitter, we added map data and images but users could do that, publishers could do that, and ou can change reading speed etc.

Mitchell

I worked with Glasgow museum zoology data. Metadata from their collection, mashed up with some images from wiki commons. Use data from sample collection to see maps app/google maps. Which museum would have been handy, could add. Read more link. It’s just a nice way to explore the collection. And we’ve added noise too! Although most sound like sheep! But if there was sound info you could build a richer experience, could add user images, build a sort of game for those visiting in person.

Alastair Macdonald

Rohan adds a top fact: Alastair was the first person to sign up to CHS this year!

I was tempted to use the Richard Demarco data – 6000 images from 65 years of the fringe. I wanted to run the images through facial recognition software to see faced and change over time. But far too many images to process. But you can quickly see features like glasses etc. got tons f data back. Only had I’ve to put into exel to see estimated age of subjects – a peak. Early twenties, slightly more women. Glasses wearers by age also. And mood… At 47 everyone is happy! All 6 year olds are surprised! By remember its not a big data set! What’s happening is for a few years images process great, but 2000 and 2007 images seem o be scanned in and messes with data! So that was my experiment… I think it failed.

Kate Ho and interface3 team

We are generally interested in digital storytelling. And we built everything for our game in 2 hours built on Edwin Morgan’s stobhill. It’s from multiple perspectives, it’s a very grim tale about a young URL who had to have an abortion and just as it was about to go into the Incinerator it’s found to be alive. Its told from doctor, porter, parents and boilerman. So it’s an immersive story imagining the hospital as abandoned, has a dark creepy tone like resident evil. You poke around. And move through audio. And it is quite creepy and sinister. We want to develop this on, transported to the highlands where the conception happens in second level. Going to end en route to the incinerator.

Rory (@digitalwestie)

I’ve been working w/Glasgow unesco city of music data set. Over 7000 tracks from different artist, was ruinous about what I might like in there. I use a think called last fm which lets you hare and is over music. And there I a list of festivals in Europe ranked by kast.fm by my taste in music. Thought it would be grea to o something similar. Hence weenies love beats – a mix f Glasgow and last.fm data. So you can look at the data set from your own perspective. Lots more you could do with this data, I added 10,000 tags to this data so think I just scratched the surface.

James baster – flock lights

I used twitter data from everyone here, looked over 9000 tweets around the event. Pulled it together. Was about useful information – contacts, links, possible new connections. For each persons have inormation about their friends, ollwsm conversations to. But just around the hash tag. Can also look at word use to gather by word use and topic. Online now. More data could o in, but what would be useful? And it’s all on GitHub.

Roy, Micheal, tom and jack from Dundee

This team have two products they will be showing. Another hardware hack! We are all associated with Dundee Uni? And we have made the Skinnys jeans! They walk the event frequency of events in Glasgow.

We also Built a device to make words physical Neil I created a visualisation of one of the Edwin morgan poems. Takes each line of a Poem, finds a word, pulls in a random image from flickr. So you get a sort of visual poem. With fun and slightly random effects.

Stef and Katie and Carolyn

This was a project with the Richard demarco data and approached it by looking what was online already. An organisation has been funded to scan in one mans life works really. But the website is kind of getting in the way of the content, hard to get to photographs. so we wanted to highlight key artists and making the images stand out.

Lucy, Chris, Gavin and monkey the dog

This was lucys first coding experiment. It’s a project using arguing. A ducky flashes a light every time a #chscot tweet ones in!

James mail

I am a product designer and I was inspired by the tramway footfall data, this is a thin you could install in a gallery spaces. Releasing ping pong balls or each previous visitor that then mingle with the real visitors. John (jonbca.github) I used footfall data also. Dots bouncing represent people visiting, can see the busy times… And it’s very much a work ian progress.

Textmob

Inspired by poetry and Macbeth we decided to set up flash mob readings! We did this with twitter. You can take part by tweeting #CitizenMob. Then line are assigned to the crowd who can join in the reading

Reading betweet the lines

We did three projects. First was poems of Edwin Morgan told in others tweets who don’t even know they re takin part. Big blue word highlighting show you the connection ian a stream on random tweets. Each is retweeted letting people know to learn more about the poet.

And next we made a generator to make new poems from his work. And it works!

Finally we took university of edinburgh data and it will show the buildings and energy use over time. It animates a beautiful set of colours showing change over time and it looks beautiful but projector isn’t playing ball today.

Festory

We wanted to use edinburgh festivals data – financially worth more than golf! But it means a lot to people who take part so… Festory… We were inspired by GSA alumni archives by ended up building a way to map social memory onto festivals. made it pretty. Can add by show, place, year et. And you can add through the year. And thinking about mapping entire fringe performers. You can check into a show. Want to crowdsource photographs,  the performer’s perspective and from the audience and reviews. We had loads of ideas here, lots more work to do!

Creative Scotland – Stephanie Chris et al

My interest is in the creative Scotland data. I came up with 4 broad categories of data – capacity, impact, outcome, investment – or those interested in but outside of arts in stolen – policy makers, donors etc. so you would go in, pull in data on a project and look for how to track and monitor projects. It’s a cultural policy hack!

Ellie Harrison

Suzy invited me here. I felt a bit left out last night. I like to reduce my interaction with tech as much as possible. I was probably in the wrong place. I only got my laptop outat 2pm. And I try to avoid twitter but hard to acaommunicate here without it. So I did a little societal study of twitterholics. So I only spoke to 12 people. Thank you to all in the sample! I also wanted o ask how long each night people tweet by put didn’t know how to visualise this! Leapyearboy tweets least and sleeps least. So here are our sample. Second top is suchprettyeyes/nicola osborne who helped me put this together atbthe last minute. Alastair is our top tweeter! And signed up first!

Smash it – nick street and alex waterston

Last year I made something for stealing from Nms. What better to top it then smashing stuff from the NMS. And I must apologise as I mashed lots of data sets into the concept: Animal reincarnations of dead poets wan you to smash the glass treasures infringe venues for creative Scotland Smash more for more funding! It does work. If you want to play it… You’re mad!

And that ended the Show & Tell portion of the event. Which meant it was time for beer, cupcakes…

Culture Hack Scotland Cupcake

And then, the judges decisions… which were (according to my live tweets):

  • Commended #chscot most playful app: textmob; and creative Scotland by banned by google. Winner: Macbeth parlour game! Phenomenal!
  • Recommendation: demarco website by @stef an co. special prize for extra activity also to @stef. & prize for the audio visual player #chscot
  • Prize mentions also for mist useful the field sound recording hero, and @Alastair’s demarco project. Winner xdesign360 soundscape #chscot
  • Product hack: commended smash it, winner skinny jeans #chscot
  • Special award to the fab @kateho team as they did crazy amounts of incredible work in the 24 hours #chscot
  • Extreme excitement: the fabulour Macbeth parlour game takes top prize! #willdiscover


Delicious Share/Bookmark

Culture Hack Scotland 2012 liveblog

I’m live blogging again, this time from the opening of Culture Hack Scotland 2012 which is just opening with our first guest inspiration talk….

James Stewart, technical architecture for gov.ac.uk 

They created the Gov data alpha; Www.data.gov.uk replacement for directgov.
Tricky to talk about that here… My perspective is from London but be aware we are thinking hard about devolved presences and how that is handled.
Inside government – stuff the general public wants but not first thingEleasing 10 design principles informing what we’re doing. Trying to change very old organisations with very new tech.
1. Start with user need.
2. Do less.
3. Design with data – using request logs for data, regu,actions on what must be provided etc. we use Google Analytics and think about KPIs to inform how we do and improve this all the time.
4. Do the hard work to make it simple – what two or three questions do you need answers to to make the simplest solution for your users
5. Iterate. Then iterate again. We put out a release,get feedback, improve, iterate, blog the change etc.
6. Build for everyone – we didn’t think about accessibility at all on the alpha but we are now doing a lot to ensure all is accessible and it really helps in thinking about making things simpler.
7. Understand context. A lot of people are set in their ways but lots of others are frustrated with the system and want change. Finding those people can be really powerful. Building stuff fast makes a big difference, let’s people understand the benefit.
8. Build digital services – how do you connect up the User experience and the actual service, the thing they want solved. How do we use APIs and decoupling to do this.
9. Be consistent, not uniform. Up until now you had to learn the sites from scratch. We don’t want them to be the same but once you learn to use one you should be able to use them all.
10. Make things open. We are very open source. We put code on GitHub. And we had an early commit to flag up erroneous Scottish bank holidays etc. we want more interaction. – engage, correct us…if you do these things openly people are inclined to come and help you.
Finally note that we are hiring!
Over to i think Erin for the data…
We have split this into themes…
  • Archives – Glasgow Uni, Scottish Poetry Library
  • Content – Edwin Morgan poems, Macbeth marked up, Catarina child’s book, images from museum did art gallery
  • Listings – in Glasgow at the moment it’s the Glasgow international festival on visual arts and we have their listings, we have List, Skinny, edinburgh Festivals, Creative Scotland etc
  • Footfall data, carbon/energy use in Edinburgh
  • So lets talk data…. You could use the Richard dimarco images to chronologically track social and cultural change over time. Or you could combine the international listIngs with social media mentions.
  • Alex – I want to think
  • Sarah Drummond, award winner, has ideas next!
  • Kate Ho – we want to do something with a particular Edwin Morgan poem, stobhill, to make a computer game
  • Rory? We want an en mass party game/reading of Macbeth!
  • James – loads of collection data.. Want to build a what do I do today… Pick from various pairs of pieces when having done a few of those you get suggestions
And now…
Brigitta Zics, director of culture lab at Newcastle University
We do various projects which bring together HCI as well as art researchers, very different from social sciences! And we are around 100 researchers, always happy to hear from more!
We are all about art, design, technology, but also critical and reflective perspectives on that work. So I’ve been asked to talk about aesthetic design… Hci is very tech driven, design and interactive design and designers who try to bring this all together are also important.
I work on combinations of all of these aspects… I am an artist, I code, I’m interested in psychology as well. We can think of interaction as knowledge exchange. How does interactive work become aesthetics? I want to show some of my work here to illusate the concept. I’ve done some work on data visualisation called mirror space. People interact with an object and their facial characteridates plus data on the web created an image to reflect back.  Abouts body movement, not literal representations… This is about experience not beauty here.
One of the most inspiring things I found was an article in new scientist on a woman with locked in syndrome who knew she would lose all movement, even her eyes. So she came up with a way to communicate through her saliva. So if you imagine ph levels, she could say yes or no by having someone read the ph in her mouth and using her body in this way.
So we need to think about the user, not just cultural or social but also how we are acting, what are we doing, our physical selves. Interaction that rElates to that. So taking a sort of aesthetic ecologies type approach.
So my current project uses interaction with eye movement and screen and a heating and cooling system. So I think about monitoring the user, feeding back to them and engaging with them so I set up a sort of feedback loop here. A kind of cognitive mfeedback loop of interacting in an aesthetic way with the body.  There are some papers we have written on eye movement systems and aesthetics. And we are looking at emotional states and engaging on that level next really.
My message is to go beyond tech and thinking about people and abouT their imagination, and qualities that outlast technologies.
And with that the talk ends, the action kicks off… And the live logging pauses for some time….

Delicious Share/Bookmark

Preparing for Culture Hack Day 2012

Today and tomorrow (and hacking right through the night) I’m in Glasgow for Culture Hack Scotland 2012. I’m along to play with data, to see what cool stuff other people create and to particularly see how our Will’s World dataa marked up version of Macbeth – is used.

This is the second CHS and last year I brought a laptop and charger but not a huge amount else. However I saw some really cool projects last year including some super hardware hacks. And this year the organisers are keen to see creative responses to data… and this makes packing quite the challenge… What to bring?

Well the laptop + charger + several extension cables was a no-brainer. What else?

An iPad, mini camcorder, pico projector, sound recorder, cables, cables, more cables, various paper and pens and pencils, and a few emergency chocolate snacks all seemed sensible too…

As did some lego, sketchpad, tripod, a mini desk lamp, and clothes pegs (for improvising a screen for the pico projector – of course). And the funghi packaging? Well that’s my mini Arduino kit just in case I can think of a neat way to programme my little heart charliplex in a creative way, preferably with Macbeth data…

As for what’s in my virtual bag well that’s more exciting: huge amounts of data from the CHS; lots of tools for non/timid developers like Yahoo! Pipes, Google Docs (there’s a lot you can do with their spreadsheets), many eyes, etc; and useful hosting tools like Dropbox. Not to mention the nuts and bolts stuff on the laptop: gimp, arduino, dashcode, voodoo pad…

Watch this space to see what we create!

Delicious Share/Bookmark

Recent social media news – including EDINA’s new LinkedIn page

It’s been a while since I posted an actual blog post rather than a liveblog and I thought it might be useful to summarise some interesting new social media news that has emerged over the last few weeks. It’s in no particular order but should hopefully be of interest.

Friends Reunited re-launches. One of the very first social networks has made a very unlikely comeback recently. Friends Reunited was the Facebook of it’s day (around 2001-3) encouraging old school friends to connect and post messages on each others walls. It had a real following in the UK but it didn’t develop fast enough and when it was sold from it’s private owners to ITV it really went into decline. However with the visual appeal of Tumblr, Pinterest and HistoryPin in mind and the massive appeal of family history as a new focus the site has relaunched in a new visual nostalgic style. Those used to frequenting Mum’s Comfort Food (formerly Monster Mash) in Edinburgh will instantly be used to the look and feel which is a bit like iPlayer in I Love the 1980s mode. And a fascinating footnote: Freindsreunited are manually retrieving login details for users who can no longer remember their logins, email addresses, passwords etc. It’s notable only because it’s rare a site is around so long it justifies doing that. Although from my first login there it looks like the masses have not returned to Friendsreunited (yet) despite the press coverage.

HistoryPin adds lots of new features! Chief amongst these are Channels which allow significant customisation and aggregation of contributions. A lovely idea for individuals, local history groups etc. We were lucky enough to have Rebekkah from HistoryPin along at a JISC GECO workshop on Geospatial in the Cultural Heritage Domain last month – you see the notes from her talk – which included sneak previews of the new Channels – over on the GECO LiveBlog for the event.

Facebook launches Timeline for Pages. Anyone with a Facebook page will know by now that the old style pages rolled over to the new style Timeline on 31st March 2012. The new look and feel will be very familiar to anyone looking at friends profiles over the last few months (personal profiles having rolled over around January).  Whilst the responses to personal timelines seems to have been quite mixed I think the new format work rather well for Pages and I haven’t seen much in the way of criticism – although inevitably looking around for familiar elements takes a wee bit of getting used to.

One of the most fun parts of the new format Facebook pages is the ability to add “Covers” – large images (851px by 315px – very similar to many WordPress theme banner sizes) which have presumably been labelled as “Covers” to appeal both to those who create elaborate scrapbooks and photo albums as well as those who wish they’d been in a rock band. We’ve now got Covers in place for all of our Facebook pages – why not take a look at the EDINA AddressingHistory Page and Digimap Page both of which use nice geospatial images:

Digimap's Facebook Page showing the new Timeline.

We actually try to keep a collection of images of events, services, etc. for just these sorts of times. A number of us at EDINA are pretty decent photographers and tend to take Digital SLRs to events anyway so we make a concious effort to capture our own high resolution images that are specific to us and our work so that when it comes to sharing images, illustrating blog posts or reports, etc. we have suitable images to hand. For AddressingHistory and JISC GECO, both of which were both very much about engaging the community and encouraging them to blog we’ve found Flickr accounts really useful – sharing images of materials and events lets others out on the web create more engaging posts and talk about our projects. Talking of images…

Facebook buys Instagram for $1 billion. Old news now but still worth noting. The story has mainly been reported from a “is this the new dot com bubble” perspective which is hardly surprising as the purchase does value a free iPhone app at more than the value of subscription-based New York Times. However looking at this a bit more pragmatically it’s not quite such a daft purchase. Facebook has paid “cash and shares” and with the Facebook IPO coming up very soon it’s possible those shares are a big part of the payment and being valued highly. More importantly Instagram has a lot of the design and hipster chic that Facebook lacks, useful in itself, and will bring with it a user base and their photos – since images are, in my experience, some of the most productive sources of interaction on Facebook, that’s also significant. Instagram’s main function is to make fairly mediocre phone images look quirky, nostalgic, and tangible in a hard to explain sort of way. Adding that functionality to the photo sharing and storing aspects of Facebook seems like a good move as more of us move to experiencing the site almost exclusively on smartphones or tablets. On a sort of related note a very good recent(ish) Planet Money podcast talked about the longtail of the app economy with the founder of Instapaper.

Pinterest sees rapid growth and claims 97% of fans are female (see piece in Forbes and stats on TechCrunch). If Pininterest has passed you by so far you may be more than a little surprised at the number of new users it’s attracted in a very short time. The idea is very simple and rather familiar if you’re used to using Tumblr, the Flipboard iPad app, the new(ish) Delicious Stacks, Flickr Galleries, Storify, and any number of more obscure Web2.0 sites.  Pinterest is essentially a virtual pinboard for images – you can also add short comments and share those links/images. It’s a very basic idea but engaging because it is so visual, easy to use, and the interface is based on big buttons, easy browsing etc.  Like many predecessors it’s a custom magazine for the web but, unlike many of those, it also has a big user community. And for reference websites with no “pinnable” images cannot be pinned/saved/shared so it’s a great reminder to always include a good image on your webpresences – particularly if you can share something eyecatching!

Citizen Olympics Reporting. Two recent and exciting citizen reporting initiatives have been kicked off recently. The first and larger is #media2012, a reporting network for the Olympics. They held a recent kick off meeting which you can read about here. There is also an associated project to provide crowdsourced blog coverage of the Scottish arm of the torch relay which goes by the name CitizenRelay. Read more about getting involved here.

And finally… EDINA has a new LinkedIn page! If you head over there you can start following us for updates and news. And if you are a current or former staffer here do update your profile to create a connection back to the page. We’ve actually been planning to create a LinkedIn page for a while so it’s really good to see it live!

And even more finally… Our Will’s World project (#willdiscover) has launched and is contributing data for this year’s Culture Hack Scotland. The data is here in case you’re interested but there will be much more on that to follow…


Delicious Share/Bookmark