Farewell from PhoneBooth

It’s been some time since work on the project completed, and this post has been delayed by the process of scheduling the implementation of the prototype locally at LSE. But the prototype application is now available: http://phone.booth.lse.ac.uk/

We still consider this a beta release, so please do let us have any feedback on your experience. The project has been massive learning for us in terms of mobile and geographic technologies and we have all sorts of exciting ideas for future development!

phonebooth


notebooks-list

notebook-portrait

notebook-landscape

The previous two posts contain the detailed project report as required by JISC. Thanks to Ben Showers our programme manager for support.

The project could not have been done without our technical partners at Edina who have produced some pretty awesome tech, worked through some challenging features of the content, and patiently shared their knowledge throughout to ensure we were able to get the best learning we could about these new areas of practice. Thanks to all involved throughout the project.

Posted in Uncategorized

Final project report, part 2

5.       Lessons Learnt

What are the key points for effective practice – Briefly identify the most important points in the case study/development for other practitioners – these may include risks as well as benefits.

Applications for external funding and partnerships with external, expert organisations are a viable way of upskilling local staff in emerging technologies and areas of practice. Although, there is still significant work required to take proofs-of-concept or prototypes into production as live services.

Mobile and geographic technologies are complex to implement successfully but provide engaging and useful ways of providing access to digital collections. The proliferation of mobile and location-aware services in the wider technology environment coupled with increasing mobile device ownership in the LSE community makes these important areas in which to maintain investment in skills.

The Library should focus more attention on front-end user experience, to ensure that use of digital collections across a range of devices remains at the forefront of technological opportunity and expectation. In the medium-term, the library should consider funding an additional Digital Library post dedicated to this specialism.

 6.       Technical Approach

What are the technologies, standards, frameworks etc that you used in the project? Which techniques and technologies worked particularly well? What have been the technical issues of these technologies? What advice would you give others engaging with these technologies?

 Postgres (with PostGIS extension) – to hold point data about the notebook entries

MapServer – to serve the Booth map at required zoom levels

TileCache/MapProxy – to cache the tiles from MapServer for delivery

Open Layers – to combine: 1) notebook points, 2) the Booth map and 3) a base map of LSE choosing

Issues and challenges

 Extracting content from the legacy (c.2000) application

-          lack of organisational knowledge or adequate documentation

Georeferencing

-          missing data from ‘master’ (stitched) map

-          variable quality results on ‘master’ map

-          second attempt using 13 ‘pre-master’ maps

Base map choice

-          proofs-of-concept with each option

-          default decided through user testing

 pb_mapchoice

Registration (‘georectification’)

-          improved through use of ‘pre-master’ maps

 pb_rectification1pb_rectification2

 Native vs open web vs hybrid

 Started with Open Web application

-          Increased sustainability (open standards, minimal additional skill set)

Investigating Hybrid approach

-          Performance issues running map layers and overlays in mobile browsers

-          Doesn’t seem to be bandwidth problem on 3g(?)

Possibility of a future Native app

-          Best performance?

-          User expectation, profile on app stores

 7.       Conclusions and recommendations

This should include general suggestions and/or recommendations to others who may be exploring similar ideas.

 Impact of mobilisation

    • Students have shown significant engagement and enthusiasm both with the process of designing and testing and application and with using the application in the field
    • The application has enabled innovative teaching and assessment which has been recognised within the institution and provided opportunities for collaboration with academics and departments

Mobile and geo library services

    • The new ways of surfacing content have led to plans for more mobile and geo-retrieval of collections and several follow-on projects are already in planning
    • Open technology enables reuse of the same technical components to rebuild the desktop Booth site, and to think about new ways of presenting search results within LSE Digital Library, both of which are also at the planning stages

Technology skills in libraries are essential

    • Users surveys and analytics showed an increasing cohort of mobile users, and the project found enthusiastic support amongst students. Lending devices helped to ensure that the approach is inclusive and we expect to see even greater uptake of mobile access methods in coming years.

Posted in Uncategorized

Final project report, part 1

1.       Major Outputs

List the outputs from the project e.g., the final ‘product’ (this should point to the code as well as screen shots etc), reports, websites etc.

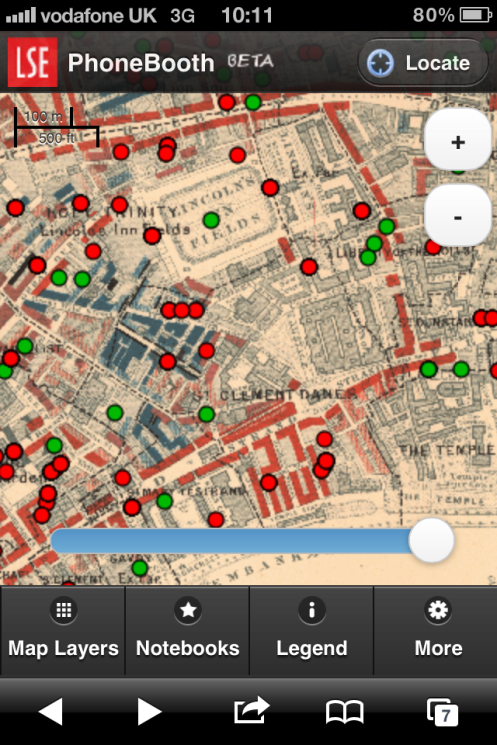
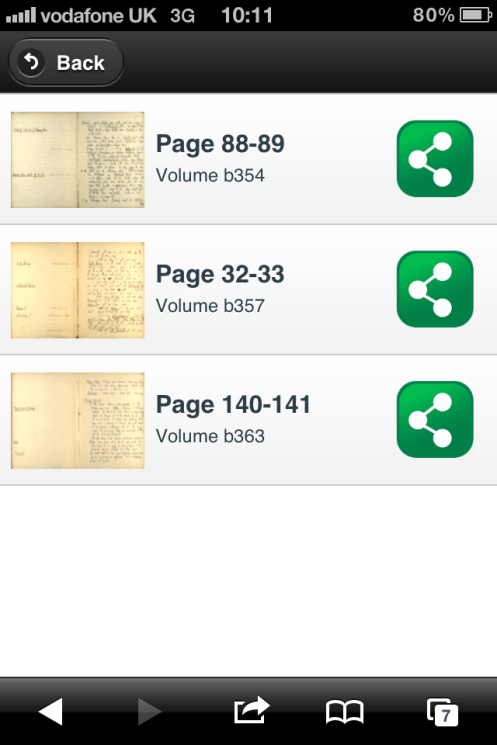
 The main output of the project is the PhoneBooth prototype, which we are making available as a ‘beta’ product: http://phone.booth.lse.ac.uk/

 We are still planning how to develop the application further for general release, but we are keen to make what has been developed so far available and to solicit feedback.

 Other project outputs are listed below:

 • Project communications (blog, Twitter)

• Reporting (JISC, LSE Digital Library Steering Board)

Project blog: http://jiscphonebooth.wordpress.com/

Project Twitter account: http://twitter.com/jiscphonebooth

Final project report: [this blog post!]

• Report on user requirements

• Revised course syllabus

• Functional requirements

User requirements: http://jiscphonebooth.wordpress.com/2011/11/28/phonebooth-begins/

Functional requirements: http://jiscphonebooth.wordpress.com/2012/01/12/from-user-to-functional-requirements/

The revised course syllabus is still in preparation for the 2012/13 academic year.

• Booth maps and notebooks in georeferenced preservation and delivery formats

• Knowledge transfer to LSE

EDINA have delivered new versions of the Booth data in standardised formats, and versions suitable for delivery to mobile devices.

 Aspects of the knowledge transfer have been completed (we run a version of the technical stack and application from LSE Library servers) and the LSE Digital Library Developer has spent a week with the geodata experts and mobile application developers at EDINA.

• Fedora/Hydra content models for geodata

• Ingest of Booth content into LSE Digital Library

• API for spatial query of Booth content

 The technical approach decided on by EDINA (as technical partners in the project) does not integrate with existing digital library technologies in exactly the way described in the project bid, due to necessities of implementing the required functionality. This does impact the preservation or delivery of the content: the application is built using open source technologies that complement and extend those already in place, and the service will be available from LSE Library servers and Digital Library or Booth web domains.

• Prototype web application (initial version delivered April 2012 for testing, refinements and knowledge transfer to complete by June 2012)

• Knowledge transfer to LSE

 The prototype application has been tested successfully on iOS versions 4 and 5 (iPhone4, iPad2), a range of HTC/Samsung Android devices (versions 2.x and 3.x). A demonstrator hybrid app exists for Android which could form the basis of further development to produce native apps for Android and iOS. Blackberry and Windows phones were deemed out of scope for the time and money available in the project.

 Knowledge transfer to LSE has increased our understanding and implementation of mobile and geographic technologies, which will form the basis for the rebuild of the desktop Booth site in 2012/13 incorporating the New Survey of London Maps.

• Use of the prototype in the 2011/12 ‘London’s Geographies’ course

• Report on findings: pedagogical impact

• Refinements to the course syllabus for 2012/13

• Case study on the development of mobile content and its impact on teaching

 The 2011/12 student cohort piloted use of the app, and their experience has informed a revised course syllabus which is being produced for 2012/13. A separate report and case study on the pedagogical impact has not been produced.

 2.       Background

Give brief details of institution, type of learners and learning environment in which the activity/ies took place. Also outline the Intended outcome(s) of the project and the aims and objectives of the original project plan, and have you met those objectives?

 LSE Library provides support to teachers in using primary sources in their classes. London’s Geographies is a 2nd/3rd year undergraduate course that visits the archives and uses the Booth material in their coursework. The aim of the course is to interpret the geographies of the city in relation to the past and to link present realities to those portrayed in historical sources. Students currently consult the archival material either physically in the Archive reading room or digitally via a computer workstation.

 The overarching aim of the project was to make the archive material available for use on mobile devices  by enabling the current location of a user to be plotted onto the Booth map and nearby notebook entries to be presented for reading ‘in-the-field’.

 Project objectives:

  • To enhance the existing Booth data to enable mobile delivery

 The project has produced a mobile version of the Booth maps and notebooks: http://phone.booth.lse.ac.uk/

  • To produce a model and technical capacity for the mobile delivery of Library-owned content

 The Library now possesses mobile (and geodata) knowledge and skills. The PhoneBooth technology can be used to serve other, similar content to mobile devices. For other collections, our learning about mobile technology puts us in a much stronger position.

  • To engage with LSE academics and students involved in the London’s Geographies course to inform the development of mobile Library content

 The GTA and students of the London’s Geographies course produced user requirements describing their pedagogical aims in using the application which were used as the basis for prioritising and generalising the functional requirements that were provided to EDINA as the spec for development. The student cohort has tested the app in the field and their findings have influenced technical refinements to the prototype.

  • To evaluate the impact of mobilised content on teaching

 The mobile Booth content has made a clear impact on the way aspects of the course are taught (there is now more emphasis on the archival content being used in the field) and assessed (use of the notebooks as sources for personal research will be required in one of the pieces of coursework for the coming academic year).

  • To enhance the student experience of the course

 The students have been overwhelmingly positive about the app and have also commented favourably on the Library being involved in such an undertaking.

  • To facilitate knowledge transfer within the professional community

 LSE have benefitted significantly from our involvement with EDINA, and through presentations at two Mobile Library events (an information sharing event sponsored by JISC and the Fourth International M-Libraries Conference) we have been able to share our learning with the wider community.

3.       The challenge / mobile advantage

What problem/use case was it that the project sought to answer – what was the challenge (or opportunity!) that it was tackling. This may include an assessment of established/current practice, and include any aspects which were subsequently amended.

 The aim of the project was to enable new ways of interacting with archival material. Previously to PhoneBooth, students would consult archival materials in the physical reading room, then take print-outs of digitised map images into the streets to carry out comparative field work.

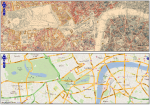
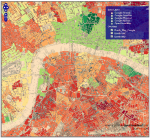
The mobile application allows immediate access to the archival material from the location of the field work, allowing a direct connection to the surroundings and links to modern mapping technology and contemporary government open-data sets such as the Index of Multiple Deprivation.

This new way of delivering content has allowed revisions to the course syllabus placing more emphasis on use of the archival material, and new forms of assessment based on the coursework excercise of using the archival content in the location to which it refers.

 4.       The Mobile Advantage

What do you expect the benefits to be from the project (or what benefits have already been realised)? What have been the benefits of the project as experienced by learners, practitioners and/or the institution as a whole? How has ‘mobile’ transformed previous practices as highlighted above?

  • London’s Geographies will benefit from a new teaching method which will serve as a case study and model for the institution which is actively seeking innovative teaching and assessment methods

The application has been incorporated into the assessment methods for the course in academic year 2012/13. The technology is being used to increase reliance on primary sources. The Teaching and Learning Centre at LSE have been encouraging of these innovative methods during the project and we will be reporting our impact findings to them as they emerge during the coming academic year.

  • LSE Library will benefit from prolonged engagement with academic and students and the co-design of Library content and services to support teaching—activities which are not possible to such a degree of detail under normal business

The student cohort fed a large amount of requirements into the project, giving an in depth account of their expectations and/or hopes for the role of mobile technology in their experience of Library content. It was only possible to address some of these requirements during the project, and others could be approached at a later date, augmenting the functionality of the prototype with social and user-generated content features.

  • LSE Digital Library will benefit from capacity to innovate with already digitised content, a prototype application for mobile delivery and the opportunity to share in the knowledge of EDINA as national leaders in geographic and mobile technologies

We have benefitted enormously from our association with EDINA and knowledge transfer to our internal team. We have learnt a huge amount about mobile and geographic technologies, to the point where we are able to run the prototype application locally, critically consider the benefits to each of the various ways in which to progress from prototype to launch, and take on the rebuild of the desktop Booth site using the same technologies that were implemented during the course of the project.

  • EDINA will benefit from involvement in a project that aligns with its core mission to provide expertise, services and support to the UK HE/FE community.

EDINA have both fulfilled community responsibilities and been able to align the R&D aspects of PhoneBooth with developments that will benefit their mobile delivery of other services they operate. They have been able to deliver a prototype “hybrid� application from Android devices as a result of this synergy, exceeding the requirements and scope of the project.

  • The Fedora and Hydra communities will benefit from content models and prototype applications to support the geo-discovery and mobile-delivery of digital content. Adopters of this repository system and application framework will have the opportunity to reuse the content models and application code in their own repositories and digital libraries.

Due to the technical approach of the project there is no direct benefit to the Hydra/Fedora communities, other than awareness of what other adopters are doing in parallel within their digital library considered in the broader context.

Nevertheless, the open source technologies and approach of the project are available for adoption by another other institution with similar content, requirements, and technical capacity.

  • Other audiences for Booth who will benefit from new delivery methods.

We have had positive reception from PhD students at LSE and UCL who have heard of the project and participated in early user testing, as well as from UCL academics and Library professionals through the various conference presentations and online communications that have been part of the project.

Posted in Uncategorized

Phone Booth now and into the future

With all of the results now in from the questionnaires, it is time for final thoughts. The questionnaires highlighted that while there was room for improvement, the students found the technology itself more than acceptable which was a relief. There were, of course, numerous suggestions as to how to make it better, with a particular focus on linking to additional information related to the maps and the areas themselves. Everyone, including myself, had a little trouble reading some of the notebook entries on my phone (something which I didn’t find particularly difficult looking at the entries themselves), scanned as they are in their original handwritten form. It might be interesting to think about crowd sourcing typed versions of the entries.

In terms of building the app in future projects, I thought it was very interesting how after using the app itself, several people thought audio would be really useful. They wanted to be able to just click on the link and hear the entry read out rather than reading something. There was also a desire to be able to plan out a route, or follow a planned route, which is something we had discussed but weren’t able to complete in the time we had given. For myself after much playing around with the application, I still think the most important addition would be to map out the routes that the surveyors themselves followed, as many of the notebook pages refer to several addresses and streets but are only coded for one. By looking at the route you can get a much more complete sense of the exact places the diaries mention.

Some of the detail from the students was most encouraging, and it was brilliant to see such enthusiasm for the project. They were asked to say which locations they had tried to access the maps from, and here is one description:

Catherine Street, Covent Garden; Kingsway: While the main roads along Catherine and Russell Street have remained the same, Kingsway and the crescent along the Aldwych is completely unrecognisable. What surprised me was that the entry recording the area around the Aldwych described the community as an Irish working class … [she continues to reflect on this area when asked how useful the app would be for the class] After I was able to use it, I found it so useful. In fact, it is the transparency settings that enable me to understand from a planning perspective how areas in London have changed. I recall in GY244 where Nead was writing on the planning of a large street Kingsway and Aldwych in order to make Embankment a focal point of the city. The comparison of the maps, past and present allow for me to appreciate this better.

After the end of term we decided to open the testing to include other LSE students who hadn’t necessarily been in the class to get a wider range of perspectives on the functionality. It was encouraging to see how the app seemed to dovetail perfectly into the teaching of other departments such as Social Policy (and encouraging to see that knowledge of the school’s history and foundations remains alive as well!):

This would actually be a really amazing tool as we study how Booth’s study paved the way for social science and led to the development of welfare. I think it would also be quite good for LSE students in general, as Booth’s study is integral to the development of social science as a discipline. It was also what inspired the Fabians to start the LSE.

I was also encourage that some of my students though that they would take this beyond their student days, and use it not just to appreciate and enjoy London on a deeper level, but also to understand the histories of different neighbourhoods. One student thought it would be useful to:

Learn more about places of public interest (Westminster etc.) as they were, though more specifically for me to learn about – or at least get more interested in – history of various places in Tower Hamlets (borough I’ll be working in and therefore will feel massive sense of responsibility to serve as sensitively, enthusiastically etc. as possible)

While this was true for some, others thought this would work really well as part of a class, but didn’t know if they would access it or use it on their own. This makes me think that perhaps more work could be done on the front end of it, a little walk through or introduction to Booth as part of the app which might make it easier for anyone to just download and use. This was mentioned specifically by one respondent, but seemed to be important to several others, while they didn’t quite vocalise it explicitly.
In thinking about next year and how to use the application, the class lecturer and I had already discussed trying to encourage students to immerse themselves in the city and its history, by requiring that one of the essays involve reflections on Booth’s project incorporating journal entries from the area of the student’s choice. Given that discussion, it was nice to see that students thought that this would be a good direction to take as well:

We could do a walking tour of London in the Nead week or the week where we study about Booth and the social improvements in London. The immediate question that comes to mind linking the app’s work and our course is “How have the social improvers like Booth depict and visualise London? (e.g. in terms of poverty, etc.) How has it had implications for planning in London? Perhaps a question set for the first assessed assignment in next year’s project could be something linked to this.

I definitely like the idea of the walking tour as well, and I’m thinking about how to incorporate the phone app into something like that…it would be essential to focus on discussion and not simply make it a meander with each individual staring at their phone (however amusing that would be for everyone around us), but it definitely seems like something we should try!

Posted in Uncategorized

Initial round of student feedback

After having given the technology a couple of test runs myself, I met up with a couple of students to have a brief chat about the Booth maps, the Phone Booth app, and its potential as a teaching and learning tool. This is just one part of the total feedback we are collecting, as not everyone could make the meet up today, and everyone is also filling out questionnaires on both the technology and the app’s potential for class use. Given that we are now a few weeks into the summer, it was fewer students than I had hoped as collective energy can be brilliant for generating ideas and critiques. Still, it was nice to see people again and good to know that some of the students were still willing to make a special effort to support the project.

The technology was the first topic of conversation. It was agreed that the app takes a long time to load on the phone (and on older models does not load at all), which is problematic for ease of use when out and about on the street. Everyone agreed it was easier to use on a laptop or home computer, which isn’t precisely the point of the project but still important. The simple fact of being able to see notebook entries by location made it possible to interact with the journals in an entirely different way, which was key. As one student said, “anything that fixes info to location is very useful.� This is definitely something I have also found, both in my teaching and learning. There were a few other issues remaining, but the focus of the discussion was on the pedagogical potential.

This year all of the students in GY244 were asked to do a final project for the class. The very broad question they were asked to respond to was “Using particular events, sites, personalities or projects, how might we see London as a palimpsest?� The directions continued:

palimpsest n. and a.

1.     Paper, parchment, or other writing-material prepared for writing on and wiping out again, like a slate.

2.      A parchment or other writing-material written upon twice, the original writing having been erased or rubbed out to make place for the second; a manuscript in which a later writing is written over an effaced earlier writing.� [Oxford English Dictionary]

The British satirist George Orwell writes in Nineteen Eighty Four that “All history was a palimpsest, scraped clean and re-inscribed exactly as often as was necessary� (Book 1, Chapter 3.) In what ways might we ‘read’ the city similarly, as having been written over many times, with aspects that are never completely erased. How might the layers of the past be seen in the present, so that the geographer’s work is to understand the co-existence and interplay of many spaces and times in one place? Geographer Doreen Massey argues that we should think of all places as intersections of processes, connecting wider (regional, national, global) processes to everyday life in particular places. All these viewpoints refuse the idea that places are isolated from events in the past and elsewhere, or that people can be bounded into closed categories.


We were particularly interested in the ways in which students were able to see echoes of the past in the present, the continuities and disjunctures in the fabric of the city. It was nice to hear that students themselves were most interested in taking more knowledge of this away from the class, though in a much more concrete and real-world form it may be said! I think that is one of the things I most love about the Booth archives, is the way they can be used to open up a comparison of past and present through both the map (invoking politics of representation and categorization along with the impact of making data visual) and the journals upon which they are based (an additional set of questions around methodology, the blurred line between quantitative and qualitative data, the relationship of researcher to those researched, the mediating role of the police escorts and etc). One of the comments echoed the earlier requests in our initial brainstorm on what such an application might do, in that it would be very desirable to have the additional functionality of comparing the map and journal information with current applicable sources, even if only by link. Looking at current measures and mapping of poverty was mentioned again, perhaps being able to see them side by side. I love how spending time with the maps awoke student interest in comparing the different ways in which poverty has been seen, recorded and measured in the past and the present, which might be a very good thing to better incorporate into the class. I’m not so sure if it would work for the app, but possibly for the website?

The geographical limitation of the maps was brought up as well, as London has crept far beyond the Booth map’s original boundaries. But where projects and the map overlapped, they generally thought it would have been useful. Another student in thinking about how the app might have impacted her final project, said that it wouldn’t have helped at all (she had done a fantastic project on the development of shopping centres over time). But she thought that having access to such an application might have changed her initial choice of project, allowing her to see other areas and possibilities that might have been much more interesting…she was also interested in looking at the Booth maps and journals as measurements of people’s well-being in a sense, possibly the same as their poverty but not entirely and the framing can definitely change the way you would think about such a map and the things that you might look for.

They also both thought that the lecture on Booth and the maps could be better carried out in the field in future classes, with students able to be walked through the process of data collection and able to use their phones themselves to pull up journal entries. We would certainly then have to ensure that all students had access to smart phones.

Finally, the app was seen to have a lot of potential for other classes beyond GY244 and even Geography. The core undergraduate course, GY100, spends a couple of weeks looking at the Booth map and poverty measures, and it seems like such an application might be the perfect way to ease undergraduates into discussions of difficult subjects. One student definitely felt that the maps were a perfect opening to learning how to think critically about information, which was important as he didn’t feel that they did this in the same way in other courses. Another student had friends in Social policy who she thought would also really benefit from this, along with Economic Geographers and the LSE Cities program.  GY250 incorporates a project mapping house prices in London and running regression, both thought it was interesting comparison to the Booth maps and the way they were built.

In sum, the initial feedback was very positive despite technical difficulties, and provided a lot to think about in terms of developing future curriculum and using technology in the classroom. There will be more forthcoming, which I am looking forward to.

Posted in Uncategorized

PhoneBooth prototype

We have put together 4 proofs-of concept which demonstrate the ways we can now manipulate the Booth map and notebooks. We are now working towards testing of a prototype mobile application in the next few weeks.

Proofs-of-concept

There are four demonstrators:

  1. Booth map shown side-by-side, and …
  2. … overlaid transparently on a Google base map (other base maps will be available in the final version, including Open Street Map and Ordnance Survey)
  3. Booth map overlaid with the Index of Multiple Deprivation 2010 (source: Department of Communities and Local Government, mapping by CASA/UCL)
  4. Booth map with notebooks entries available for reading, linked to the page level

booth-sidebyside
booth-transparent
booth-imd
booth-notebook

The side-by-side map and transparent overlay show the basic mapping functionality: retrieval of a location on the Booth map on the basis of a current location supplied by browsing a modern map (or vice versa).

The inclusion of the Index of Multiple Deprivation shows a government open data set being mashed up with the historical map (via some rendering by CASA/UCL: http://casa.oobrien.com/booth/) to facilitate comparison between the historic and contemporary geography of the space.

The rendering of the notebook entries shows the availability of eye-witness observations in the locality (which were the basis of the coloured, economic classifications of the streets).

The prototype

The proofs-of-concept demonstrate the ways in which the Booth data can be manipulated. Next, we need to be able to make that functionality available in a usable, mobile application.

Here is a screenshot of the current development version:


We have a development freeze scheduled for 18 June, which will be followed by some serious, in-depth testing in-the-field.

Posted in Uncategorized

Improving on the Georeferencing

As a follow up to the previous post about pulling apart the old application, this post will describe the efforts that have been made by Edina to improve on the accuracy and quality of the Booth map image that will be utilised by the mobile application.

After a bit of digging LSE were able to supply us with scanned copies of each of the original 12 map sheets that make up the full Booth map. These new map sheets demonstrated a much higher resolution then the original map and were therefore clearer at higher zoom levels. Importantly for our purposes this gave us the benefits of improved readability of map based text (especially streets) and also an enhanced ability to discern between the colour shading of the streets that form the central part of the booth map.

The individual maps came as tiff files but in a more traditional presentation format and each image included a title, legend, scale indication (in furlongs) and a border around the map. For our purposes none of this information was required and as we wanted to join the different map sheets together, these additional items needed to be removed. Adobe Photoshop was utilised to crop all the images as close as possible to within the applied border and to smooth out the edges of the images.

Now that we had a copy of each of the maps in the correct style we needed to georeference them, both against an Ordnance Survey backdrop and also a Google Maps backdrop. The free and open source GIS package Quantum GIS (QGIS) was used for this as it has a plugin for loading a variety of web services into the map canvas – including Google Maps, OpenStreetMap, Yahoo and Bing. Additionally QGIS can host the Ordnance Survey web service Edina provides called OS Openstream, thus providing us with both our backdrops to georeference against.

More information on this can be found here:

QGIS Openlayers Plugin – http://tinyurl.com/7p5n8ku

EDINA OS Openstream – http://tinyurl.com/7ygzxwc

Georeferencing the full 12 sheets did take a while as each sheet required 15 or more control points and the process also had to be repeated for the two different map projections. The resulting map sheets fitted together like a jigsaw puzzle but because some of the maps covered parts of the same area there were large parts that overlapped. Again Photoshop was utilised to cut out certain areas of the map sheets to reduce the overlapping but also to fit the sheets together cohesively. The resulting new map instantly demonstrated a vast improvement on both the georeferencing and also the clarity at high zoom levels. We built a simple Openlayers demo site to compare the new map to the old map side-by-side and the results were pretty conclusive.

However, the new map did not come without problems. As a consequence of the improved georeferencing, unfortunately in some cases the sheet edges did not match particularly well. More effort could be spent on dealing with and mitigating this issue, but within the timeframe of the current project it has to be considered as a bit of a trade-off: a vastly improved map image in exchange for the slight miss match at some of the tile edges.

Posted in Uncategorized

Mobile Libraries Conference 2012

The project team will present a paper on PhoneBooth at the M-Libraries conference at the Open University 24-26th September 2012.

The abstract is copied below.

http://www.m-libraries.org/

PhoneBooth: ‘mobilising’ library-owned digital content for use in teaching

Ed Fay (LSE), Andrea Gibbons (LSE), James Reid (EDINA)

We will present the results of the PhoneBooth project which is repurposing digitised, library-owned maps and notebooks for delivery to mobile devices and use in undergraduate teaching.

The Charles Booth Maps, Descriptive of London Poverty and selected police notebooks, which record eye-witness descriptions of London street-by-street, are used in London’s Geographies, a 2nd/3rd year undergraduate course which interprets the geographies of the present in relation to the past as portrayed in historical sources.

The mobilisation enables students to consult the historical archive in the contemporary location to which it refers, revolutionising the relationship to the content. Further pedagogical impact is delivered through functionality allowing students to bookmark and reference their interaction with the material, which is used as the basis for new forms of assessment.

A prototype mobile web application was developed at EDINA using open source technologies which were incorporated into LSE Digital Library for delivery. This utilised the expertise of EDINA and upskilled LSE staff in mobile and geo technologies, providing foundations for future digital library service developments. The integration of technologies into the existing digital library technology stack and the preservation of the content within LSE Digital Library ensure sustainability.

The application will have been piloted in May 2012 by the current course cohort and the project will investigate the extent to which the mobile delivery has changed perceptions of the role of the content and the library in the teaching process.

We conclude that the ‘mobilisation’ of library-owned content can have a significant impact on pedagogical method; that mobile and geo delivery provide the basis for innovative library service development; and that mobile technology skills are becoming an essential component of the modern library.

PhoneBooth was funded under the mobile libraries strand of the JISC Digital Infrastructure Portfolio 12/11.

Pulling apart the old application

Following on from our teleconference we here at Edina thought it was a good opportunity to provide a blog post on our findings so far, and try and give a brief outline of the information we have been able to extract from the data provided to us by LSE.

The first task was to try and locate the map images that have been utilised by the old web application and we came across the Booth map and a more modern Bartholomew map of London. Both maps were in the MrSID format (interestingly developed in the USA for the storing of fingerprints for the FBI), but importantly for us is proprietary in nature and we needed to convert the images to a different format.  In the GIS world a commonly used set of tools for translating and transforming geospatial data is offered by GDAL; the ‘Geospatial Data Abstraction Library’. (http://tinyurl.com/yw34w4 ). These tools provide a variety of command-line utilities and using ‘gdal-translate’ we converted the MrSID maps to tiff files, a more commonly used format in GIS.

Now that we had a usable tiff image of the Booth map, the first major issue we came across was that unfortunately the map did not appear to be georeferenced, meaning that there were no accompanying files, or indeed any imbedded information that would establish its location in terms of map projections or coordinate systems.  This is a major problem and without this information overlaying the image over modern maps would be impossible.  (For more information on map projections take a look here:  http://tinyurl.com/25gltb ). From a little digging around into the old application it seems that the georeferencing had been applied via the use of Perl scripts and it would be difficult for us to extract the required information, so we would have to try and georeference the map ourselves manually.  The process of georeferencing an image involves selecting a set of control points and relating them to a map with a known coordinate system and projection – thankfully most modern GIS software programs handle this process easily and take away the pain of some of the complicated mathematics involved.  (A good overview of the georeferencing process in ESRI ArcMap can be found here:  http://tinyurl.com/2whflza).

  • The projection that you select when georeferencing has a strong baring on the quality of the result. If you choose a map projection similar to that used by the initial map (Booth map), you have a much better chance of matching the control map. As it appears that the Booth maps were derived from a base of the old ‘county series’ of Ordnance Survey (OS) maps, it is highly likely that they were created using the ‘Cassini Projection’ as this was the projection most commonly used at the time. (The Ordnance Survey give a brief history here:  http://tinyurl.com/84pjb4d).  This leads us to make the selection of the OSGB 1936 projection otherwise known as the ‘British National Grid’.  In many ways this was the successor to the Cassini projection and is still used today. Choosing this projection will also make things easier later on when we try to integrate any new service with items such as gazetteers and additional mapping.
  • At Edina we have access to all modern Ordnance Survey base maps and these were used as our control maps. We didn’t select the Bartholomew map simply because it is slightly dated and would probably not be used in any application we develop.

Ultimately the software provides a service to stretch the Booth map and try and fit it against the backdrop of the more modern mapping.  The results so far have been encouraging but will still need some tweaking. It is also important to note that with the Booth maps being produced over 100 years ago, they used old surveying techniques and didn’t have the benefit of modern technology such as GPS so in some cases it may be impossible to get a ‘perfect match’, the hope is to get the best you possibly can.

An additional finding while digging through the data included a postgres database schema containing geographically referenced point information, with one table alone containing 47,000 points!! The tables include a variety of information such as postcodes, streets, wards, landmarks, parishes and walks.  The first thing we noticed is that the data is stored in simple straight tables and is not spatially enabled.  PostGIS is an open source software program that adds support for geographic objects in the postgres database and the data will need to be processed to fit the new data model. Once the data fits the PostGIS model, GIS web applications can interact with the data more easily and adds additional facilities such as coordinate transformation support, advanced indexing, the ability to store polygon and line data (as well as points) and also offers the killer ability to perform queries against the data via spatial SQL. Utilising Spatial SQL will allow us to answer questions such as:  ‘show me all the notebook entries within one mile of my location’, or ‘show me all the notebook entries in a certain postcode’.  There are many more advantages of spatially enabling your database and more information can be found here: http://tinyurl.com/27aqmor).

From an initial look at the data held in the tables the quality or accuracy can be improved upon and we will be investigating what our options are here. Importantly though, there is a clear link between geographical locations and notebook pages.

Other discoveries were of the many scanned images of the Booth notebooks and additionally Booth’s family magazine called ‘The Colony’. For many of these there appears to be multiple copies in different formats: a ‘gif’ thumbnail preview, and a larger version in ‘jpeg’ and ‘DjVu’ formats.

So now that we have:

  • A georeferenced Booth map (may need some tweaking)
  • A postgres database schema  with geographically referenced point information (needs translating into PostGIS)
  • Scanned images of the Booth Notebooks (needs linking to the database tables)

we have the building blocks to start developing a GIS web application for initial demonstration purposes that possesses all the tools familiar to the users of products such as Google maps.  This will allow us to examine the relative success of our georeferencing process and also give us the ability to test out some of the core and optional functionality defined in a previous blog post.

Posted in Uncategorized

From user to functional requirements

Following discussions with EDINA we have agreed on a catagorisaton of desired functionality: core (or ‘must-have’), optional (or ‘nice-to-have’) and out-of-scope.

Core functionality

  • Maps delivered in resolutions suitable for mobile devices
  • Map scroll-able, zoom-able to different levels of detail
  • Plotting of current location on the map using supplied GPS location
  • Plotting of location points on the map (to represent notebook entries)
  • Showing a walkable route plotted between multiple locations on the map
  • Browse of available location-points by category (taken from the catalogue – e.g. “Irishâ€� or “butchersâ€� etc.)
  • Notebook entry pages delivered to a page-turner (or some sequence of multiple pages) – linked through the location points plotted on the map
  • Notebook entries to have an email function (email me this page/location entry) for retrieval from a desktop

Optional functionality

  • Mash-ups with external content – e.g. the police street-level crime data API, or Yelp to determine which businesses listed in the notebooks are still present today
  • Crowdsourcing comments on location entries
  • Audio narrations of location entries or walks
  • A pub crawl walking route of pubs that existed at the time of the map/survey!

Out-of-scope

  • Transcription of notebook entries

Posted in Uncategorized