The Statistical Accounts of Scotland Online – My statacc

This is the second in a series of blog posts about some of the functionality you may have come across (or may not have yet discovered!) in the new Statistical Accounts of Scotland Online. Here we concentrate on the new My statacc feature.

We have now introduced functionality to enable more personalisation when using the service. If you are a subscriber you can now save, annotate and tag  individual pages, whole sections, illustrations and maps. You can use the star button to save. The label icon allows you tag items with one or two words of your choice, so that you can find them easily when you next visit  (just type your words into the box), and the post-it note to write longer annotations which are stored alongside the item.  If you are planning to coming back to a particular page, image or section, you can store information about why it is interesting, how it relates to your research or how you might want to use it.

These new features are designed to allow you to easily find and review content of particular interest to you. Tags and annotations are stored against your profile, and will remain there until you delete them. Just sign in and click on the My statacc red button on the top right of the page to find everything you have saved.

A screen-shot of the Statistical Accounts of Scotland showing personalistion features and the transcript functionality.

A page of the Statistical Accounts of Scotland showing personalisation features and the transcript. Screen-shot captured on Thursday 1st December 2016.

You can tag, annotate and save both sections and individual pages. Individual pages can be printed out and whole sections of the Statistical Accounts can now be downloaded as PDFs. You can even share what you have found on social media by clicking on the sharing icon and follow the links. Using these features is so easy – just click on the relevant icon and away you go!

We are particularly pleased to be able to offer such personalisation, which will help you to get the most out of your searching and browsing of the Statistical Accounts of Scotland Online. Please let us know what you think.

More information on all the features mentioned above, as well as others, can be found in the Statistical Accounts of Scotland Help Pages and the How to get the most out of the Statistical Accounts of Scotland online page. If you have any comments or queries please contact the EDINA Help Desk (edina@ed.ac.uk).


Share

The Statistical Accounts of Scotland Online – Images and Words

This is the second in a series of blog posts about some of the functionality you may have come across (or may not have yet discovered!) in the new Statistical Accounts of Scotland Online. Here we concentrate on the images and maps, as well as the transcripts found on the website.

Images and maps

The new service contains a number of illustrations and maps published with the original accounts. Your search may result in a box containing the thumbnail views of related images or maps. As a subscriber you would be able click on these to view them (in a gallery view) in a much higher resolution than before. You are also able to zoom in and out, which is fantastic to be able to do! All other relevant images are on the left-hand side of the gallery view, making it easy to scroll and browse related illustrations and maps.

There are a number of interactive maps available in the service, which we are able to feature courtesy of the National Library of Scotland. One example is the map of Scotland on the homepage, where you can click on the map to open out a larger version, and as the mouse cursor moves over the map you will see the names of counties highlighted. There are also interactive maps available on the county pages, showing each of the parishes clearly within the county and allowing you to click through to more information on the parish.

A screen-shot of an interactive map for the southern part of Northern Part of Ross and Cromarty Shires, taken from the Statistical Accounts of Scotland.

The interactive map for the southern part of Northern Part of Ross and Cromarty Shires. Screen-shot taken from the Statistical Accounts of Scotland Online on Thursday 1st December 2016.

Transcriptions

Another greatly improved feature is that of the transcripts, which are available for most pages in the Statistical Accounts. The reading quality of the transcription has been improved through rendering the text in html, making it an even more useful to aid understanding when reading the Statistical Accounts.

We hope that these new features mean you get even more out of the wonderful wealth of information found in the Statistical Accounts of Scotland. More information on all the features mentioned above, as well as others, can be found in the Statistical Accounts of Scotland Help Pages and the How to get the most out of the Statistical Accounts of Scotland online page. If you have any comments or queries please contact the EDINA Help Desk (edina@ed.ac.uk).

Share

Welcome to the new and improved Statistical Accounts of Scotland online!

As you may have already noticed, the Statistical Accounts of Scotland service now has a new look as well as new and improved features. We hope you have been exploring them since the new service was launched at the beginning of November. This is the first in a series of blog posts about some of the functionality you may have come across or may not have yet discovered! Here we concentrate on the search and structure of the new website.

Improved search

We have aimed to allow searching in the same way as you would use an internet search engine. The service will look not only for direct matches but also for possible variations and related terms.

Search features include:

  • The ability to limit your search to the old statistical accounts or new statistical accounts by adding either OSA or NSA to your search terms, e.g. OSA schools. It is also possible to limit your search still further by stating the actual volume and even the specific page, e.g. OSA vol5 pg27.
  • The ability to search by geographical area, by using one of the eight cardinal compass points in your search term, i.e. N, NE, E, SE, S, SW, W, NW.
  • A subject search which allows you to search for pages which are discussing a particular topic but which may not mention the exact word. The system looks at the words you type into the search box and tries to deduce any subjects you might be interested in or you can include the subjects directly. The full list of subjects can be found on the How to get the most out of the Statistical Accounts of Scotland online page. This functionality is a little experimental at the moment, so it would be great to get any feedback on this feature.
  • The ability to search the related resources, with access to these available from the main search results page. Please note that related resources, such as digitised versions of Sinclair’s Specimens of Statistical Accounts (1793) and Analysis of the Statistical Account of Scotland (1825-1826) and related surveys such as the Stow Census, are only available to subscribers.
  • Associated words which is another experimental feature that may present words that frequently appear in proximity to your search terms. If your search term returns a box of associated word you can click on these words to explore terms related to those you are interested in.
A screen-shot of a search results page form teh Statistical Accounts of Scotland Online

Search results page showing a number of features of the new service. Screen-shot captured from the Statistical Accounts of Scotland Online on Wednesday 30th November 2016.

County and Parish Pages

We also wanted to make it easier to search for material that is related to specific places, and tried to do this by bringing together information on each parish or county on one dedicated page. These can be navigated to using the maps, as well as the search box. These pages present all the content we have that is related to that county or parish, alongside a county or parish map and a brief description, extracted from the text. From here, you can view the map in high resolution, navigate to the county page if you are on a parish page, or navigate to one of the accounts or resources related to the parish if you are on a parish page.

We hope that the improved functionality and re-design of the Statistical Accounts of Scotland will both allow you to find the relevant information quickly and to explore other related information easily. Try the new features and discover more about Scotland’s counties and parishes.

More information on all the features mentioned above, as well as others, can be found in the Statistical Accounts of Scotland Help Pages and the How to get the most out of the Statistical Accounts of Scotland online page. If you have any comments or queries please contact the EDINA Help Desk (edina@ed.ac.uk).

Share

Wicked Witches

In our last post we revealed some of the Halloween customs detailed in the Statistical Accounts, including some spooky ghost stories.  Although superstitious beliefs seem to have been receding during the late Eighteenth Century, there are nevertheless many accounts of another devilish figure in the accounts: the witch. Such stories give us a real insight into what people in the eighteenth century and earlier believed in and how they dealt with alleged witches.

In Tongland, County of Kircudbright, the lower classes “firmly believed in ghosts, hobgoblins, fairies, elves, witches and wizards. There ghosts and spirits often appeared to them at night. They used many charms and incantations to preserve themselves, their cattle and houses, from the malevolence of witches, wizards, and evil spirits, and believed in the beneficial effects of these charms.” (OSA, Vol. IX, 1793, p. 328)

Several places are mentioned in the Statistical Accounts where witches were burnt. These include: near the Old Castle of Langholm in the County of Dumfries, where some of the witches here acted as midwives and had the power to transfer labour pains from the mother to the father! (NSA, Vol. IV, 1845, p.421); a hill in the parish of Mordington, County of Berwick, called Witch’s Know (OSA, Vol. XV, 1795, p. 187); another Witch’s Know in Gask, County of Perth (NSA, Vol. X, 1845, p. 282); and an upright granite stone located in the parish of New Monkland, County of Lanark, “where it is said, in former times, they burned those imaginary criminals, called witches� (OSA, Vol. VII, 1793, p. 280).

A watercolour 'The Three Witches of Macbeth' by John Downman.

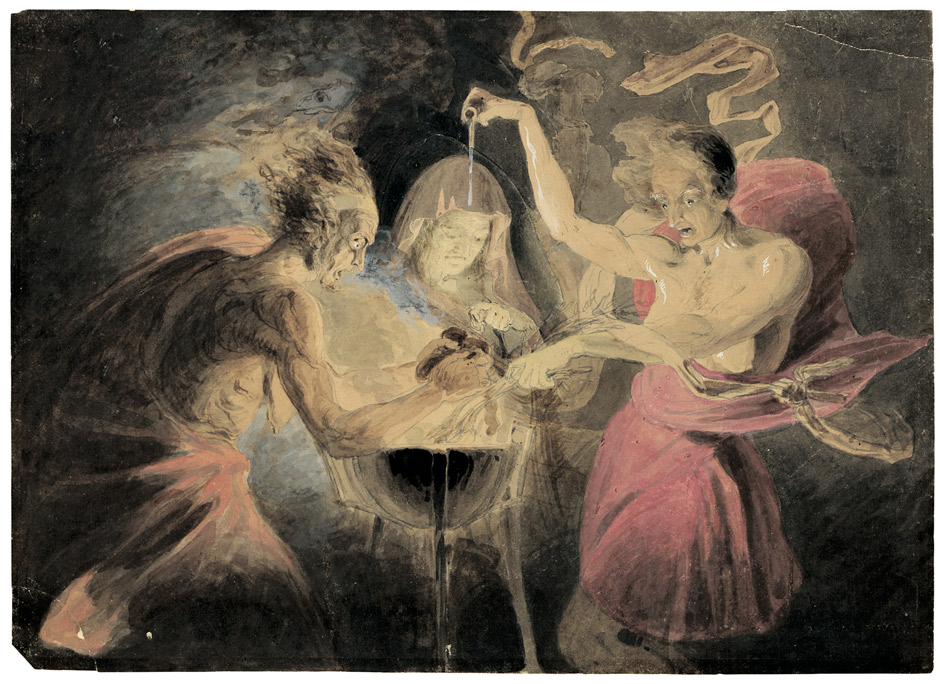
The Three Witches of Macbeth, 1824. John Downman [Public domain], via Wikimedia Commons

Spott in the County of Haddington was renowned as a habitation for witches (NSA, Vol. II, 1845 – p.227).  In October 1705, “many witches were burnt on the top of Spott Loan” and indeed it is generally believed that the last witch who was executed in Scotland was burnt at Spott; a stone commemorative of the event, marking the place of execution, is to be seen a little way to the cast of the manse. It was also here in Spott, in 1698, where the trial of Marion Lillie, otherwise known as the Rigwoody Witch, took place (OSA, Vol. V, 1793 – p 454).

Indeed, you can find a number of accounts of trials for witchcraft in the Statistical Accounts. The most complete report of a trial is that of the Trial of William Coke and Alison Dick for Witchcraft on September 17th 1633, which is found in the accounts for Kirkaldy, County of Fife, OSA, Vol. XVIII, 1796 – p.656 to 662.

Other witches are mentioned too, such as  the Bargarran Witches who were seven men and women accused of bewitching a young woman in the parish of Erskine, County of Renfrew (NSA, Vol. VII, 1845, p.507 to 508 and p.122). Other renowned witches are Lillias Adie who, in 1704, was accused of witchcraft and “afterwards died in the jail of Dunfermline, and was buried within the flood-mark between the villages of Torryburn and Torrie� (Torryburn, County of Fife, NSA, Vol. IX, 1845, p. 732) and Gorm Shuil, or blue-eyed, a famous witch from Laggan in the County of Inverness “who was such an adept in her profession that she could transform herself and others into hares, and crows, raise hurricanes from any quarter of the compass she pleased, and perform other wonderful exploits, too tedious to mention� (NSA, Vol. XIV, 1845, p. 426).

There is a really interesting piece by Sir John Sinclair on the Castle of Dunsinnan or Dunsinane and the probability that William Shakespeare had collected here its traditions on Macbeth to use it in his celebrated play! (Collace, County of Perth, OSA, Vol. XX, 1798, p.242)

Witches also had a hand in the formation of the Castle of Dumbarton! It seems that Kilpatrick, a village in Dumbartonshire, both derives its name from, and gave birth to, the celebrated saint of Ireland, Patrick. The Devil was so incensed at Patrick’s sanctity and success in preaching the gospel that he:

sent a band of witches against him; that the weird-sisters fell upon him so furiously, that he was forced to seek safety by flight; that finding a little boat near the mouth of the Clyde, he went into it and set off for Ireland; that they seeing it impossible to pursue him, for it seems they were not of that class of witches who can skim along the waters in an egg shell, or ride
through the air on a broom stick, tore a huge piece of a rock from a neighbouring hill, and hurled it, with deadly purpose, after him; but that, missing their aim, the ponderous mass
fell harmless, and afterwards, with a little addition from art, formed the Castle of Dumbarton.

(Kilpatrick-New, County of Dumbarton, OSA, Vol. VII, 1793 – p. 99)

An engraving of Dumbarton Castle by William Miller.

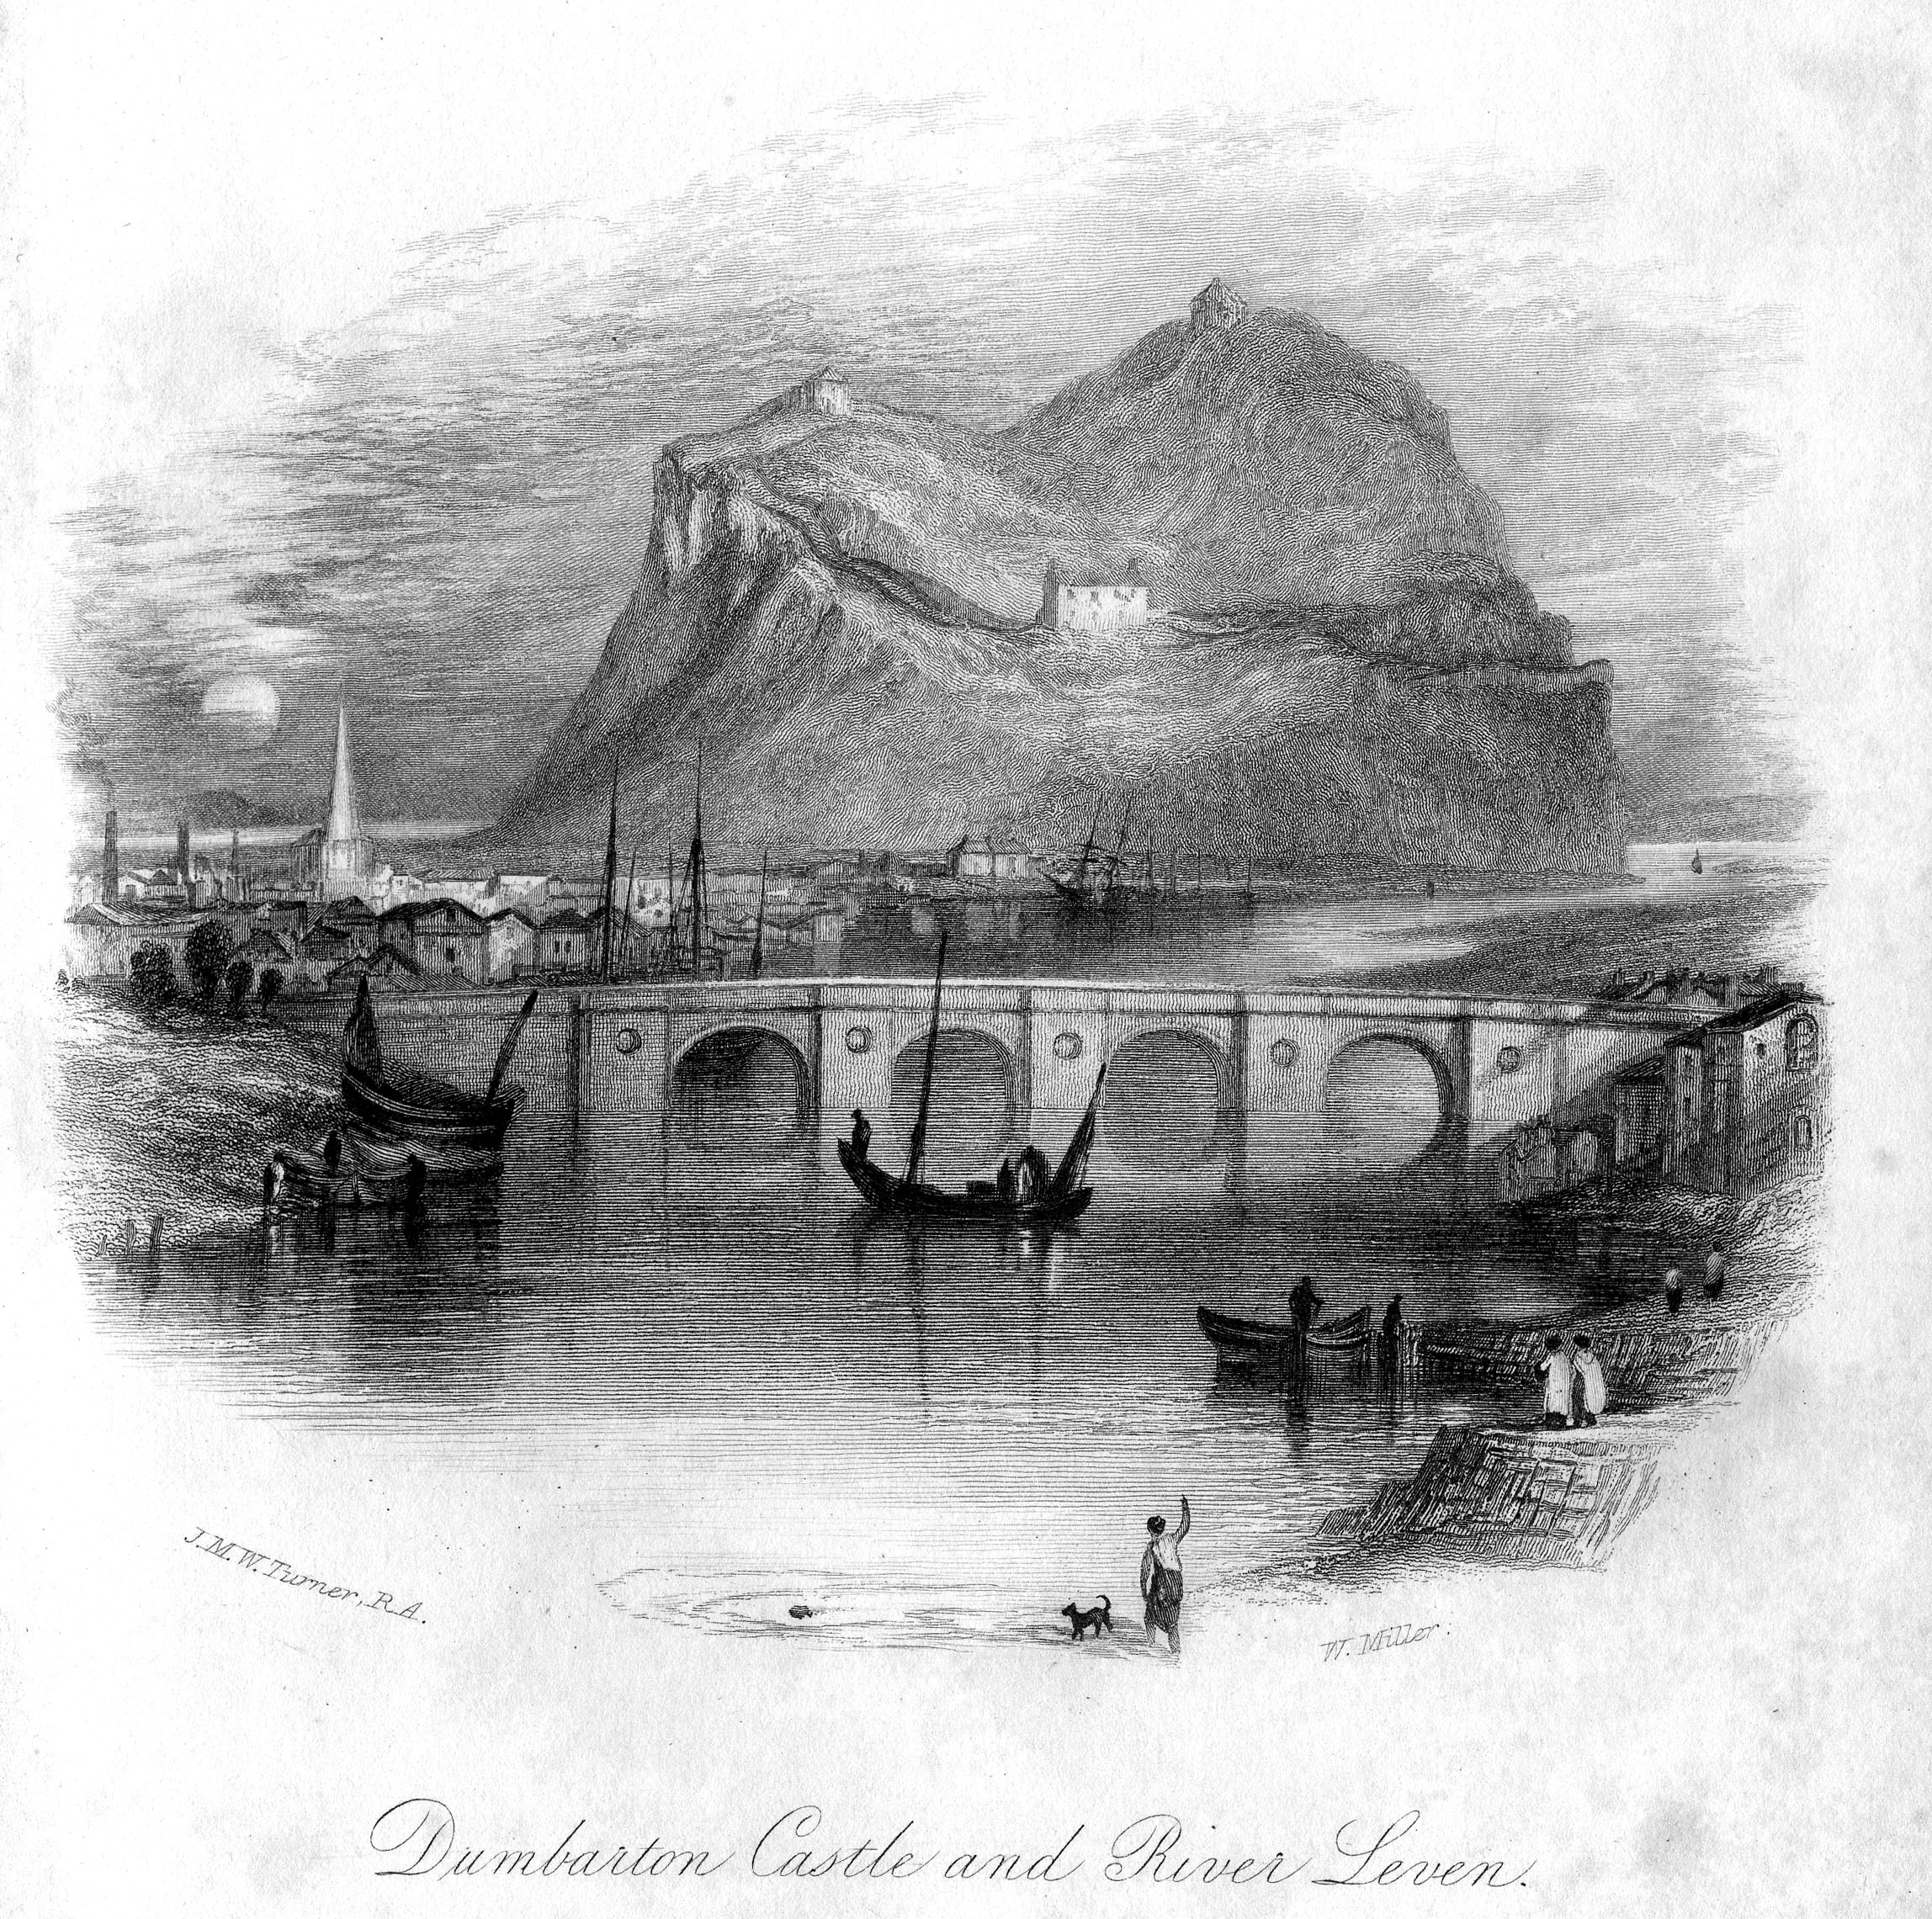
Dumbarton Castle (Rawlinson 518) engraving by William Miller after Turner. Created 1 January 1836. [William Miller [Public domain], via Wikimedia Commons]

So how were suspected witches actually dealt with? In 1563 the Scottish Witchcraft Act was passed which made both the practice of witchcraft and consulting with witches capital offences. There were many more witch prosecutions in Scotland (an estimated 4,000 to 6,000) than in England at this time. Most trials took place in secular courts and later taken over by kirk sessions, with the majority being held in the Scottish Lowlands. During 1596-97, there was an active inquiry in the County of Aberdeen when several Commissioners from the region were appointed by his Majesty “to tackle and apprehend witches, sorceraris, consultaris, and traffiquaris with witches”. (Leochel, County of Aberdeen, NSA, Vol. XII, 1845, p. 1123)

In Forfar there was “a witch-pricker called John Ford who was sent for to prick witches, and was admitted as a burgess, on the same day with Lord Kinghorn. The bridle which was placed in the mouths of the witches condemned to be burned, and with which they were fastened to the stake, is preserved in the burgh.� Also, the field in which the witches suffered is pointed out to strangers as a curiosity (OSA, Vol. VI, 1793, p. 524). Those people charged with witchcraft were brought to trial in Forfar by a special commission appointed by the Crown in 1661. Interestingly, ‘the records of these trials were preserved and contained many curious statements; but it has recently been amissing.’ (NSA, Vol. XI, 1845, p.695)

In Gladsmuir, County of Haddington, (NSA, Vol. II, 1845, p. 188) “the Lord Commissioner and Lords of the Articles, after bearing the petition, granted a commission for putting to death such of the above persons as were found guilty of witchcraft by confession, and for trying the others, which, if we may credit tradition, was put into execution�.

In the parish of Torryburn it is even reported that the first Presbyterian minister after the Revolution “Mr Logan’s great hobby appears to have been the prosecution of witchesâ€� and on April 4, 1709, Helen Kay was rebuked before the congregation for having said that the minister “was daft,” when she ” heard him speak against the witches”! (Torryburn, County of Fife, NSA, Vol. IX, 1845, p. 732)

It is actually frightening to think that people from judges to the parish elite had the power to put to death those accused of witchcraft based on such questionable evidence as witch-pricking and confessions forced under duress (torture and sleep deprivation). Thankfully, by the seventeenth century there was a growing scepticism of witchcraft and by the time Scotland became part of the Commonwealth with England and Ireland in 1652 there was a marked decline in witch trials and prosecutions. It is both a fascinating and troubled period of Scotland’s history, and the traces of this time that are to be found in the Statistical Accounts are well worth exploring.

Share

Privacy of Online Social Networks Talk – LiveBlog

This afternoon I am attending a talk on the Privacy of Online Social Networks which has been arranged by the Social Network Analysis in Scotland Group (SNAS) and is taking place at the University of Edinburgh. The speakers are Jordi Herrera-Joancomarti, Cristina Perez-sola, and Jordi Casas-Roma, all from Universitat Autonoma de Barcelona (UAB). I’ll be taking notes throughout, although I think that the talk is also being recorded so may be available later.

Share/Bookmark

The ultimate survival kit for your spatial data

survival_cover_normal

“Ubi amici, ibi opes: Where you find friends, there you’ll find riches.”
Plautus, 200 BC

“Where you find metadata, there you’ll find data.â€�
Antonius Mathus, AD 2014

Research is fundamental to all disciplines in academia and data output is often the result of this endeavour. Most universities view research data as a valuable asset that requires a management strategy to promote and support long-term data curation, preservation, access and re-use.

Universities need the resources to tie together the policies, infrastructure, tools, processes and training to support research data management. The Joint Information Systems Committee (Jisc) has played a key role in providing these resources to many universities through a range of programmes including the following:

  • Repositories and Preservation Programme, which provided an investment of £14 million in Higher Education repository and digital content infrastructure.
  • Information Environment supporting digital repositories and preservation, including cross-searching facilities across repositories; funding for institutions to develop a critical mass of content, preservation solutions and advice for the development of repositories.
  • Jisc Managing Research Data (JiscMRD) programme, which supported UK academic institutions in their efforts to develop internal research data management policies to ensure data re-use.

The GoGeo service is another example of the Jisc commitment to UK academia to provide resources to securely manage and share research data that have a geographical (spatial) component. The free service offers the following resources for managing research data:

  • Geodoc metadata editor tool, which allows users to create, edit, store, import, export and publish standards-compliant (ISO 19115, UK GEMINI, INSPIRE, Dublin Core, DDI) metadata records;
  • GoGeo portal, which offers users the option of publishing their geospatial metadata records to public or private catalogues, the latter for those who want to control and restrict access to information about their spatial data;
  • ShareGeo, a repository for users to upload and download spatial data; and
  • geospatial metadata workshops, which use presentations and hands-on practicals to introduce attendees to geospatial standards, metadata, geoportals and the GoGeo service.

The ultimate survival kit for your spatial data is a guide that provides a concise overview of these GoGeo service resources which can serve as a complement to your current research data management practices if your datasets have a spatial component. This guide also shows how the GoGeo service resources can be used to manage your spatial data information (metadata) and share it with your project colleagues, or with researchers and students in your department or academic institution.

You’ll discover that

  • it’s much easier and more efficient to use Geodoc to create and export a metadata record to bundle with its spatial dataset than it is to send the dataset without any information to a colleague who might return with questions. Your colleague can also import your metadata record to Geodoc to update if edits are made to your shared dataset.
  • it’s much easier and more efficient to use Geodoc to create and publish metadata records to a private research metadata catalogue on the GoGeo portal than it is to send bundles of metadata records or spatial data information to fellow researchers.

The ultimate survival kit for your spatial data document offers more in detail about the possibilities, the potential that the GoGeo service has to offer for spatial data management and sharing, whether at the personal level, amongst trusted colleagues or visible to the world if you have no further need of your spatial data and wish to share it with others who could benefit from your research endeavours. There could be others who have data that could benefit your research as well?

Please contact me to request a copy of this guide. The guide will include a questionnaire, and if you answer the 10 questions, you will receive a GoGeo-Geodoc coffee mug filled with chocolates. There is nothing to write other than your name and address; each question can be answered with the tick of a box.

geodoc_mug

Thank you very much.

Tony Mathys
Geospatial Metadata Co-ordinator
EDINA
The University of Edinburgh
160 Causewayside
Edinburgh EH9 1PR

My Desk tel: (0)131 651 1443
EDINA Help Desk tel: (0)131 650 3302

email: tony.mathys@ed.ac.uk

An electronic version of the The ultimate survival kit for your spatial data guide can be found on the GoGeo portal’s Geodoc login page at http://www.gogeo.ac.uk/gogeo/metadata/geodoc.htm


NHS Health Atlas – risk and disease

risk

Risk of Melanoma – from BBC and Imperial College London

NHS Choices have published a health atlas that maps the risk of a number of illnesses across England and Wales. The research behind the map, which compiles data from over 25 years, was carried out by Imperial College London.

The Data was collected between 1985 and 2009 from the ONS and from cancer registers. The 11 diseases and conditions that have been mapped are:

  • Lung cancer
  • Breast cancer
  • Prostate cancer
  • Malignant melanoma
  • Bladder cancer
  • Mesothelioma
  • Liver cancer
  • Coronary heart disease
  • COPD mortality
  • Kidney disease
  • Stillbirth
  • Low birth weight

A cursory glance at the map will reveal expected trends such as the risk of skin cancer being higher in the South-East where there is more sunshine and higher risks of lung cancer coinciding with larger cities where airborne pollutants are more likely. However, i am sure that there are other interesting observations that could be extracted if you have time to explore the data.

You can explore some of the data on the NHS Choices website and read about it on the Independent and the BBC website.

I will try to find the data and post it in ShareGeo, but until then you might want to explore this dataset that shows death related to air pollution.  I really need to get some happier datasets into ShareGeo!

GIS for avalanche probability mapping and more

When I am not doing GIS or writing about GIS I try to escape to the mountains.  They mountains have always had a magnetic like attraction over me, and are probably the reason I got into maps and geography in the first place.  Mountains are magical, dynamic places but they do present dangers to those who venture into them.  The risks and dangers increase significantly when you add snow into the mix.

Avalanches are the most obvious risk and they are not confined to the high mountains of the Alps and the Rockies.  Avalanches occur frequently in the mountains of Great Britain. In fact, the constantly changing weather in Great Britain regularly creates quite unstable snow packs.  Research into avalanche prediction and probabilities helps forecasters inform walkers and climbers and this research relies on GIS to analyse the various parameters that determine the risk.

I spotted this great article about the use of GIS in mapping avalanche probability in the Northern Cairngorms.  It is written by a PhD student at The University of Edinburgh.  They have used various data such as Ordnance Survey Panorama DTM and base maps from EDINA’s Digimap service. They have then used some free Open Source tools (GRASS – an open source remote sensing package which is also available as a plugin for QGIS.) to run the analysis.

Worth a read, oh, and there is nice pic of a slide from me! Link to the article.

Avalanche

Avalanche Hazard Map


GISRUK 2013 – Liverpool

GISRUK 2013 was hosted by The University of Liverpool between April 3rd – 5th.  The conference kicked off with a Keynote presentation from Paul Longley. Paul is well known for his long research career and his excellent text books which form the cornerstone of so many courses in GIS.  The title of his talk was “A name is a statement” and investigated many aspects of geodemographics and genealogy.  Longley highlighted the work that the Wellcome Trust had been involved in that had created a map of Britain’s genetic make-up. From this work you could see how the south of Britain was all very similar but areas such as Orkney were distinctly different to the rest of Britain.  This perhaps relates to the influence of Vikings on the islands genepool (we will forgive him a slip referring to Orkney as the Inner Hebrides). But he pointed out that the patterns reflected the sampling strategy that was used to collect the base data. This was based on 2 premises:

  1. all participants were from rural, semi-rural areas as it was thought that urban medical centres would be busier and more likely to make mistakes taking samples
  2. participants had to be able to trace both sets of grandparents.

A nice study which demonstrates the power in datasets is the Wellcome Trusts DNA database however, care is needed when analyising results as they can be influenced by the sampling strategy.

Longley then moved on to show a number of studies that focused specifically on names.  CASA has been investigating links between names and place for a while.  Pablo Mateos has a number of papers which explore these links (2007 CASA Working Paper, 2011 PLOS One paper) including analysis of naming patterns across 17 countries around the World (2011 PLOS One paper).  For anyone looking for data about names, they should look at ONOMAP (although, Onomap site is down at the time of writing).  An alternative data source might be Twitter.  If you filter the account name to leave only the ones with a proper 1st and 2nd name you can then investigate details about them such as when/where they tweet, now often they tweet and what they tweet about. However there are considerations about the base data that you have to be aware of.  It is not representative of the population as a whole. Twitter users fall into the 20-50 age bracket and users tend to be middle-classed. (I might add that while you can infer ethnicity from the twitter name, it tells you nothing about what the user considers them self to be, i.e British/not British). The final aspect that Longley presented was some initial investigations into what a name can tell you about class and background. For example, Ryan is the 6th most popular name for professional footballers but doesn’t appear in the Top 50 names of Oxford graduates (not sure where these data sets came from). I might add that it only costs £35 to change your name.

Longley also commented on the information that the Census was gathering and questioned if it was still collecting the information that analysists needed.  There is an increasing desire to know about the use of digital tech but this sector develops at such a rate that a 10 year sampling interval would not be appropriate.

Onto the first of the parallel sessions and a brief scan of the program suggested that it would be difficult to decide which stream to attend.   Rather than describe each presentation, I have grouped them together into topic themes.

Stats using R

Perhaps it shouldn’t have been a surprise that there were a lot of papers that used R.  There was a workshop on tuesday on the subject and Liverpool has a strong research group that use R as their stats tool of choice. Chris Brunsdon (Liverpool) outlined how easy it was to access data through API’s from R. The other nugget from Chris was that you could use R and Shiny to make web services, making your data interactive and allowing the user to perform some analysis over the web.  Certainly will be looking into these a bit further.

Mobile Mapping

There were a few presentations on mobile mapping apps.  Michalis Vitos (UCL) had created a pictorial based system that allowed illiterate users to record evidence of illegal logging in the Congo Basin. The app was stripped back to make it intuitive and easy for someone who may not be able to read or write to use.  Distances were estimated in terms of football pitches.  Michalis had used ODK Collect to build his app and initial tests in the field suggested that users could collect useful data through it.

EDINA showcased it’s new data collection app Fieldtrip GB which allows users to design and deploy data forms that meet the needs of their research.  Fieldtrip GB is free and is available for both iPhone and Android. Ben Butchart didn’t dwell much on the functionality of the app, choosing to explain some of the technical issues that had to be overcome by the development team.

Links

SpaceBook is a project that William Mackaness and Phil Bartie (University of Edinburgh) are involved in.  Essentially the idea is to provide information to a user about what they can see or about how to get to a place using visual aids and human interpretable instructions (target is to the left of the Scots Monument which is the tall tower directly ahead). The app adopts a speech based approach ensuring that the users hands are free to do other things such as take pictures.  The app has to make some assumptions to extract the users orientation but it would be interesting to try it out. Certainly, Edinburgh’s hilly terrain lends itself to such an app as the skyline changes as you rise and fall across the City.

Visualisation

Empires decline – Pedro Miguel Cruz

The second Keynote was given by Jason Dykes of City University London. Jason is well known for taking a dataset and presenting it in a novel way.  With an hour to fill, Jason took us through some of the more interesting projects that he has been working on and, as usual, he ran live demo’s changing parameters and re-generating the visualisations on-the-fly.  The first visualisation was from Pedro Cruz and it showed the decline of the Empires through time.  It starts with 4 large “blobs” and these slowly fragment into countries until we have a semi-recognisable world map. This would be great as a teaching aid in schools.

London Bike Hire Scheme – Map view

Other visualisations that are worth a look include the BikeGrid which takes feeds from the London Bike Scheme and allows you to view them as in a standard geographic layout and then a grid. The example for London works well as the river retains an element of geographic separation when the gridview is used.  This idea of being able to switch between geographic and non-geographic views can be taken further if you switch to a relationship view, where cluster of similar things are formed. In one example you could vary the amount of geographic control was exerted on the view and see whether or not geography was the reason for the relationship (i cant find the link to this at the moment).

London Bike Hire Scheme – Grid View

All the wiz-bang shown in Jason’s presentation is linked from his webpage. In addition, there are links to the giCentre’s utilities which should help anyone who is interested in using packages such as “Processing” to visualise data.

Other interesting things of note

There were a few other items that are worth mentioning that perhaps dont fit neatly into my hashed themes. One of these is Map-me.org, from Jonathon Huck, Lancaster University.  This site allows people to reate simple questionairs and then they can interact with a map to convey how strongly they feel about the topic using a “spray can” technique. The service is free and allows users to perform basic fuzzy geographic analysis through participatory science. The technique seems to lend itself well to applications such as locating new windfarms, or perhaps monitoring anti-social behavior in a neighbourhood.

Candela Sanchez discussed the Map Kibera project which saw slum communities map their neighbourhoods. Candela applied a similar approach to map the Shankar Maharaj Slum in India.  Candela looked at how easy it was to impliment the Kibera formula and what possible issues it threw up. The issues related to power, the local knowledge that slum dwellers had and the possibility that once mapped, the land could be “valued” and residents taxed or moved on by the landlords. Community buy-in and involvement throughout such projects is critical if they are to benefit the community itself.

Candela received the best “Open” paper award from OSGeo.  Phil Bartie won the overall best paper award.  GISRUK 2014 will take place in Glasgow.


Workflow and Processing at the Institute for Name-Studies

I started working with the Institute for Name-Studies (henceforth INS) on the Digital Exposure of English Place-Names in June, and this project has come a long way since then. One of the initial tasks of such a large collaborative, inter-universitary project was establishing a workflow between each team. These have been organised and subsequently labelled as ‘stages’: each volume of the Survey goes through eight stages before it is ready for the website. Here at the INS we play a crucial role in the quality control of each stage of the project, and I will outline our procedures and outcomes.

            Our first principal role at the INS is to ‘process’ the volumes so that they can go on to the next stages to ensure that the material will be searchable once it is online. This means that historical forms that have been abbreviated in the volume need to be accurately reconstructed and relevant footnotes copied and pasted into the text. As the digitisation process began in full, we soon came to realise that it was easier for us to accomplish these tasks by doing this work in a Microsoft Word format as opposed to using Oxygen to edit the volume in xml. Once the OCRing process has been completed by CDDA, we are sent a word file of each volume. At this Stage (known to the team as Stage 1 INS) we go through and check the high-level tagging structure for the entire volume and make any necessary amendments or changes, expand the abbreviated historical forms (or shortforms as we call them), and insert footnotes or information from footnotes if applicable. Each volume has its own peculiarities, and different editors use different styles and conventions. The process of learning and working with these different conventions has posed a number of unique problems, but simultaneously has been very rewarding because we have become familiar with the practices of past editors and better understand the Survey and its history. The shortforms in particular are sometimes problematic. In general there are three types of shortforms used throughout the Survey: ones indicated by a hyphen(s), shortforms in brackets and some where distinguishing words are separated by commas. The first category, hyphenated shortforms, are by far the most prolific, and in general they pose very few problems. The second type, bracketed shortforms, are commonly used to indicate either a prefix or a suffix to the name. Different editors have taken different approaches to these, however. The editor A. H. Smith, for example, had at least seven different interpretations for a bracketed shortform. The final type are those indicated by commas separating the qualifying elements from the generic, e.g. Great, Little Field where the names indicated are Great Field, Little Field. This convention was used in some volumes, both early and late, but not all. So far of the 30 volumes processed through Stage 1 INS we have expanded a total of 37,531 shortforms. We intend to use crowdsourcing to help us complete this element of the project, and a platform for this is currently being designed.

            Once we have finished this stage at the INS the word file and a spreadsheet with comments are sent out to the team and the file is then run through the first visualisation process. This is sent back to us at the INS, where we check the file for any line break errors and anything else we may not have spotted during the first stage. These issues are then noted and sent back to the team. At this stage, LTG at Edinburgh run this through the detailed tagging process. A visualisation of this file and the accompanying xml is then sent back to us at the INS, where we check detailed samples of parishes for re-occuring issues and where possible try to discern the reason why these were not captured. The particular type of issues that we look out for include: any problems with names, historic forms and sources, cross references, glosses, language and etymology. Since May, the LTG tool used in the tagging process has been refined to the point where many of these issues noted above now occur very infrequently.  

            At this stage, if consistent errors are found the file is sent back to LTG for refinement, and if it passes then it is sent to KCL to begin the MADs process. When a volume has been through MADs, a visualisation of the file is generated and sent back to INS. At this stage, we check the visualisation to ensure that all the Gazetteer elements are being captured correctly.

            In summary, this is a brief overview of the work that we do at the INS.