Geoforum 2013


Geoforum 2013

Geoforum 2013

EDINA had a day out in London running it’s Geoforum event. Geoforum aims to bring together Digimap Site reps from subscribing institutions around the country and showcase some of the new functionality in EDINA’s geoservices. It also gives site reps an opportunity to ask questions to the Digimap team and to chat with other reps about how information about, and support for, services is provided. There was a live blog running throughout the day which is well worth a read if you did not manage to attend the event. Links to videos and slideshare will be added as soon as they are available. The keynote speaker was delivered by Shelley Mosco of The University of Greenwich.  Shelley is a member of the The School of Architecture, Design and Constructionand  described the ways in which spatial data could be used to inform design. Shelly was keen to mention the importance of spatial data and GIS in the implementation of Building Information Models (BIMs).  BIMs have been used in large engineering projects for some time, however the government is making them mandatory for all publicly funded building projects in England and Wales. This means that commercial organisations will be looking for students to have been trained in the concept of BIMs and the software that drives them.  You can find out more about BIMs through the following links:

Geofurum 2013 keynote

Geofurum 2013 keynote

Shelley then handed over to two of her current MSc students who gave brief overviews of their experiences of learning about GIS and using spatial data in their projects.  Both David Parfitt and Rob Park were self-confessed GIS newbies, but they managed to get data from Digimap and use it in their conservation projects. The data allowed them to visualise and analyse the environment and provide evidence to support their proposed designs.  Their demo’s were excellent and really showed the power of simple GIS analysis.

You can view the slides from this presentation here:

Shelley_Geoforum

Digimap Data and a non-traditionalist approach – Shelley Mosco

Next up was a presentation that focused on Open Source Resources for Geospatial. The presentation looked at data, software and web-mapping. The main resources are listed below:

Data

  • OS Open data is available through the Digimap Data Download service.
  • ShareGeo Open is a repository for open geospatial data. It has lots of useful and interesting datasets on a variety of subjects such as wind farms, crime, boundaries and DTMs
  • Data.gov.uk – the uK government’s open data store

Software

  • QGIS – one of the best open source GIS out there. Lots of functionality and plugins that allow you to perform complex spatial analysis. It is also well supported by forums.
  • gvSIG – anther fully functioning GIS.
  • GRASS – a remote sensing package aimed at serious remote sensor’s. If you are a newbie to remote sensing, you can access GRASS tool through the GRASS plugin for QGIS which makes things really simple.

Web-mapping

Digimap is a great web mapping tool, but how can you create your own interactive web map for your website?

  • MapBox – simple intuitive web site that helps users build interactive web maps. Basic functionality is free, more advanced functions are available for a small fee.
  • Leaflet – the engine behind MapBox, it is free but requires user to do a “bit” of programing
  • Openlayers – an alternative to Leaflet which is more flexible. Openlayers powers Digimap. Requires a fair amount of programming knowledge.
  • MapServer – implements Openlayers for enterprise scale operations. MapServer is also used for Digimap services.
OpenSource

Open and “Free” Geo Software & Data – slideshare

Fieldtrip GB – data capture, simplified
Fieldtrip GB is a data capture app from EDINA. It simplifies the process of capturing data in the field against quality cartographic mapping. It is equally at home in urban environments as it is in rural ones. Custom forms allow users to design their own data capture projects and collect exactly what they need for their research.  The session gave a brief overview before running a “live” group data collection exercise.  A custom form was created and deployed to participants mobile phones. They then headed outside and captured data on things like building fabric and design.  After 15 mins everyone reconvened and the collected data was “synced” and exported to Google Earth.
You can view the slides from this presentation on slideshare:
FtGB Slideshare

FtGB Slideshare

FieldtripGB – data capture simplified from Addy Pope

As mentioned earlier, there is a transcript from a live blog (how on earth can anyone type so fast!!), so if you didn’t manage to attend and want to find out what happened please check it out.


Mbtiles and Openlayers

Mbtiles and Openlayers

I was testing the feasibility of adding an overlay to openlayers map that is displayed on a mobile/tablet device .

The overlay is going to be in mbtiles format the made popular by MapBox.

The mbtiles db will be accessed locally on the device this useful when bandwidth is poor or non 3g tablets .

The mbtiles format is http://www.mapbox.com/developers/mbtiles/ described here.

Its is basically a sqlite database that holds a collection of  x,y,z indexed tiles.

Webkit based browsers including mobile versions support this although its not actually part of the Html5 spec.

The main issue of using mbtiles locally is actually getting the database into the right location.

Another is the speed at which the device can render the images. The overhead in extracting blob images to the resulting  base64 encoded images.

There are a couple of ways this can be done however.

Getting Mbtiles on Device/Browser

With Phonegap

You can use the  FileTransfer object in phonegap to copy the database locally from a server. It will be downloaded to the Documents folder on the iphone by default.

http://docs.phonegap.com/en/2.7.0/cordova_file_file.md.html

example code to download an mbtiles db.

var fail = function (error) {
     console.log(error.code);
}

var doOnce = window.localStorage.getItem("doOnce");
   if(!doOnce){
       window.localStorage.setItem("doOnce",'true');

   window.requestFileSystem(LocalFileSystem.PERSISTENT, 0, function(fileSystem) {
       fileSystem.root.getFile('testDB2.db', {create: true, exclusive: false}, function(fileEntry) {
           var localPath = fileEntry.fullPath;
           if (device.platform === "Android" && localPath.indexOf("file://") === 0) {
               localPath = localPath.substring(7);
           }
           console.log("LOCAL PATH  "+ localPath);
           var ft = new FileTransfer();
           ft.download('http://dlib-tahay.ucs.ed.ac.uk/nls2.mbtiles',
           localPath, function(entry) {
               console.log("successful download");
           }, fail);
       }, fail);
     }, fail);
   }

Use the phonegap web sql plugin  https://github.com/pgsqlite/PG-SQLitePlugin-iOS.git  and open the database like.

window.sqlitePlugin.openDatabase("'testDB2");

The benefit of using a phonegap sqllite plugin – allows flexibility where you download the mbtile db to and removes the device dependant limits on database size.

Also if a browser drops native web sql support then it doesn’t matter.

Or.

Rather than download a remote database you could copy over a local database at startup.

The simple way to add a prepopulated SQLite DB in PhoneGap from this blog

http://hansjar.blogspot.co.uk/2013/04/how-to-easily-add-prepopulated-sqlite.html


If you want to keep it an entirely non-native web app based solution or desktop browser (webkit based – Chrome Safari you might be able to use a tool like.

https://github.com/orbitaloop/WebSqlSync


There are more suggestion on stackoverflow here but I not tried them.


http://stackoverflow.com/questions/1744522/best-way-to-synchronize-local-html5-db-websql-storage-sqlite-with-a-server-2?answertab=active#tab-top


By using the syncing by creating an empty local mbtiles database and then populating it by inserts via data from the server is going to adversely affect performance. I have not tried this so I dont know how well it would work.

OpenLayers integration

First thing is to subclass an Openlayers TMS class.

/**
* Map with local storage caching.
* @params options:
*     serviceVersion - TMS service version
*     layerName      - TMS layer name
*     type           - layer type
*     isBaseLayer    - is this the base layer?
*     name         - map name
*     url            - TMS URL
*     opacity        - overlay transparency
*/
var MapWithLocalStorage = OpenLayers.Class(OpenLayers.Layer.TMS, {
   initialize: function(options) {

       this.serviceVersion = options.serviceVersion;
       this.layername = options.layerName;
       this.type = options.type;

       this.async = true;

       this.isBaseLayer = options.isBaseLayer;

       if(options.opacity){
           this.opacity = options.opacity;
       }

       OpenLayers.Layer.TMS.prototype.initialize.apply(this, [options.name,
                                                              options.url,
                                                              {}]
                                                      );
   },
   getURLasync: function(bounds, callback, scope) {
       var urlData = this.getUrlWithXYZ(bounds);
       webdb.getCachedTilePath( callback, scope, urlData.x, urlData.y , urlData.z, urlData.url);
   },
   getUrlWithXYZ: function(bounds){
          bounds = this.adjustBounds(bounds);
       var res = this.map.getResolution();
       var x = Math.round((bounds.left - this.tileOrigin.lon) / (res * this.tileSize.w));
       var y = Math.round((bounds.bottom - this.tileOrigin.lat) / (res * this.tileSize.h));
       var z = this.serverResolutions != null ?
           OpenLayers.Util.indexOf(this.serverResolutions, res) :
           this.map.getZoom() + this.zoomOffset;

       //inverty for openstreetmap rather than google style TMS
       var ymax = 1 << z;
       var y = ymax - y -1;
       var path = this.serviceVersion + "/" + this.layername + "/" + z + "/" + x + "/" + y + "." + this.type;

       var url = this.url;
       if (OpenLayers.Util.isArray(url)) {
           url = this.selectUrl(path, url);
       }
       return { url: url + path, x:x, y:y, z:z};

   },
   getURL: function(bounds) {
       return OpenLayers.Layer.XYZ.prototype.getURL.apply(this, [bounds]);
   },
});

Notes

this.async = true;

as it will have to receive images from the local sqlite database asynchronously  as  web sql has an asynchronous callback style API.

       var ymax = 1 << z;

       var y = ymax – y -1;

All this does is invert the y axis tile to handle openstreetmap not required for google style TMS.

The is a good site that describes the various types of TMS around.

http://www.maptiler.org/google-maps-coordinates-tile-bounds-projection/

The Database Setup

"use strict";
var webdb = {};

function getWebDatabase(){
   if(typeof(openDatabase) !== 'undefined'){
       if(!webdb.db){
           webdb.open();
       }
   }
   else{
       webdb = undefined;
   }
   return webdb;
}

webdb.open = function() {
 var dbSize = 50 * 1024 * 1024; // 50MB
 webdb.db = openDatabase("'testDB2", "1.0", "Cached Tiles", dbSize);
}

webdb.onError = function(tx, e) {
 console.warn("There has been an error: " + e.message);
}

webdb.onSuccess = function(tx, r) {
 console.log("Successful Database tx " );
}

webdb.createTablesIfRequired = function() {
   console.log("Creating DataBase Tables");
 var db = webdb.db;
 db.transaction(function(tx) {
   tx.executeSql("CREATE TABLE IF NOT EXISTS " +
                 "tiles(zoom_level INTEGER, tile_column INTEGER, tile_row INTEGER, tile_data TEXT, mapName TEXT)", [], webdb.onSuccess,
           webdb.onError);

   tx.executeSql("CREATE UNIQUE INDEX  IF NOT EXISTS " +
                 " tile_index on tiles(zoom_level, tile_column, tile_row, mapName)", [], webdb.onSuccess,
           webdb.onError);
 });
}

function hexToBase64(str) {
   var hexString = str.replace(/([\da-fA-F]{2}) ?/g, "0x$1 ");
   var hexArray = hexString.split(" ");
   var len = hexArray.length;
   var binary ='';
   for (var i = 0; i < len; i++) {
       binary += String.fromCharCode( hexArray[ i ] )
   }
   //getting a stack error on large images
   //var binary = String.fromCharCode.apply(null, hexArray);
   return window.btoa(binary);
}

webdb.getCachedTilePath = function(callback, scope, x, y, z, url ){
   var db = webdb.db;
   var resultsCallback = function(tx, rs) {
       console.log('resultsCallback *********************' );
       console.log('rs.rows.length ' + rs.rows.length);

       if(callback) {
           if( rs.rows.length > 0 ) {
               var rowOutput  = rs.rows.item(0);
               var tile_data = rowOutput['tile_data'];
               //strip off the hex prefix
               tile_data = tile_data.substring(2);
               callback.call(scope,"data:image/png;base64,"+hexToBase64(tile_data));

           } else {
               callback.call(scope, url);
           }
       }
   }
   db.transaction(function(tx) {
       tx.executeSql("SELECT quote(tile_data) as tile_data FROM tiles where zoom_level=? AND tile_column=? AND tile_row=?", [z,x,y], resultsCallback,
           webdb.onError);
   });
}

Notes

When you have larger blobs in the database you can’t use the overloaded array version of String.fromCharCode as I was getting stack memory issue on the device. (iphone).

So you have to loop through and build it manually.


You have to use the quote function on the tile_data blob to turn it into a hex  string.

“SELECT quote(tile_data) as tile_data

Then trim the hex prefix X’ of the hex string before base64ing.


Testing if you just want to test the javascript /html5 with mbtiles you can copy your mbtiles database to the correct folder .


/Users/murrayking/Library/Application Support/iPhone Simulator/6.1/Applications/667F70EF-D002-425D-86C9-5027C965C518/Library/WebKit/LocalStorage/file__0/0000000000000001.db on a mac


or Chrome on mac as well.


Users/murrayking/Library/Application Support/Google/Chrome/Default/databases/http_localhost_8080/13

Overall

This approach is a bit convoluted.

Esp  the conversion of the blob to base64 and performance is a bit poor on older devices. But on newer devices its acceptable.  And as devices become more powerful it will become less issue as with all html5 javascript type things.

Not tried it yet on Android but should work. Worked in the Chrome browser on the linux box.

It does allow you to use rich openlayers framework cross platform without having to invest in native versions.

Also you can debug and test using a desktop browser which is fast before doing proper testing on the actual device.

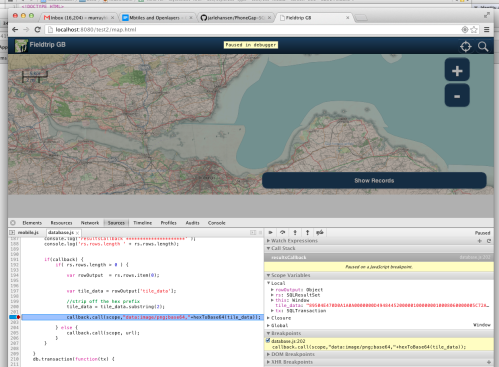
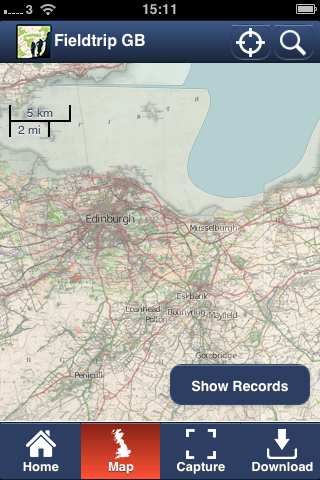
Example Screenshot working on iphone3g using Phonegap and Mbtiles.

Development version based on our Fieldtrip GB app http://fieldtripgb.blogs.edina.ac.uk/ available on android and iphone.

Overlay is historic map in mbtiles format from the National Library of Scotland.

IMG_0608

Debugging on Chrome non-native

working on chrome

Geo-tools for Teaching and Learning

I’ve been out and about quite a bit over the past 2 months, mainly to promote Fieldtrip GB but this has given me the opportunity to sit through some interesting presentations and i have found out about a number of great tools that i thought i should share with you.

Polldaddy – this is an online service that allows you to create and conduct quick polls.  You can view the results immediately so the exercise can become interactive when you are teaching. You can use Polldaddy on websites or through mobiles with their app.  Quick, easy and effective.  The free account gives you 200 survey responses a month and up to 10 survey questions per survey. There is a Pro account which cost $200 per year.

Skitch – Skitch is a annotation application from the makers of Evernote. Skitch allows users to annotate images and screen-grabs, adding extra information and notes.  This could be great when students are out in the field. Students could take a picture and then augment the picture with their own notes e.g. adding in a fault or rock unconformity. One neat feature is the ability to sketch on maps, the app launches Google Maps you just sketch away. Skitch is available for iPad/iPhone, Android, iOS and Windows.

Skitch

Skitch annotations on a photo


SkitchMap

Skitch annotation on a map

Fotobabble– Fotobabble allows you to add audio clips to images, they call it talking photos and slideshows.  This could be a great way to convey information to students, give them a visual representation and then some audio which triggers a discussion point. Or, get the students to use it to augment the photo’s the capture in the field.  This way they will not be left trying to remember what on earth  the photo is supposed to represent.

Fotobabble

Fotobabble – talking photo’s

iSpot – this one is a bit different, it is a project which aims to crowdsource ecological mapping, but there is a twist.  The user can take a picture of a plant and submit it.  iSpot has a team of experts who will identify the plant species and provide the user with some information about the plant.  This is neat in that the users get information that they are interested and the project team get data from locations around the UK.  An example of a symbiotic crowdsourcing scientific project?  Quite possibly.

iSpot

 Google Earth Engine (coming soon) – Google Earth Engine is Google extension of customisable views in Google Earth.  With Earth Engine users can upload their own data and perform simple spatial analysis on them. The obvious advantage with Earth Engine is that users dont really have to worry about base mapping data, they have access to all the imagery from Google Earth.

Google Timelapse datasets – this is what large organisations can do if they focus their processing power.  Google has made mosaics with all the data from Landsat 5 and Landsat 7.  This is a huge amount of data and a colossal amount of processing.   Some great examples of the time lapse include:

This stuff was the preserve of the remote sensing scientists, but is now accessible to anyone with an internet connection. This would be great for demonstrating any temporal change that has occurred since 1984, as long as it is big enough to be visible from space.  


Fieldtrip GB – this is an app fro EDINA that enables users to capture data on their phones. Users can choose to create their own data collection forms and once collected, data can be exported to csv, kml and geojson format.  The app is also suited for collecting data as a group exercise, a great idea if you have lots of students and want to crowd-source data collection to demonstrate an example. There is a blog article on how to set up a group exercise on the FtGB blog.

Fieldtrip GB

Fieldtrip GB

In addition, there were a number of apps that were worth a look.  I have listed them below with the briefest of descriptions. If you want more information, then just click the links and have a play.

  • QuakeFeed  (Apple) Earthquake feed for most of the World.
  • Earthquakes (Android)Earthquakes is a quake application that based on multiple data sources. With this app, you can get the latest earthquake info immediately from all over the world. Also, you can search the earthquakes occurred in the past.
  • GPS Note (Apple) With GPSnote you can easily add, edit and delete notes on the map.
  • OS Converter – (Apple) Easily convert between British National Grid References (i.e. OS Grid Refs) and Latitude, Longitude coordinates (both OSGB36 and WGS84 are supplied).
  • Altimeter – get heights in real time.  Android – DS Altimeter. Apple – Travel Altimeter 
  • Clinometer – measure slopes. Android – Clinometer   Apple – Clinometer HD
  • Decibel Ultra – measure noise levels in the field. Android – Decibel-O-Meter. Apple – Decibel Ultra
  • Rainfall Radar – takes feeds from rainfall radar satellites and trigger an alarm if you are about to get wet. Android – OSM RainAlarm Apple –  MyRadar

That’s about all i can remember, if more comes back to me then i will add it to the post.


GISRUK 2013 – Liverpool

GISRUK 2013 was hosted by The University of Liverpool between April 3rd – 5th.  The conference kicked off with a Keynote presentation from Paul Longley. Paul is well known for his long research career and his excellent text books which form the cornerstone of so many courses in GIS.  The title of his talk was “A name is a statement” and investigated many aspects of geodemographics and genealogy.  Longley highlighted the work that the Wellcome Trust had been involved in that had created a map of Britain’s genetic make-up. From this work you could see how the south of Britain was all very similar but areas such as Orkney were distinctly different to the rest of Britain.  This perhaps relates to the influence of Vikings on the islands genepool (we will forgive him a slip referring to Orkney as the Inner Hebrides). But he pointed out that the patterns reflected the sampling strategy that was used to collect the base data. This was based on 2 premises:

  1. all participants were from rural, semi-rural areas as it was thought that urban medical centres would be busier and more likely to make mistakes taking samples
  2. participants had to be able to trace both sets of grandparents.

A nice study which demonstrates the power in datasets is the Wellcome Trusts DNA database however, care is needed when analyising results as they can be influenced by the sampling strategy.

Longley then moved on to show a number of studies that focused specifically on names.  CASA has been investigating links between names and place for a while.  Pablo Mateos has a number of papers which explore these links (2007 CASA Working Paper, 2011 PLOS One paper) including analysis of naming patterns across 17 countries around the World (2011 PLOS One paper).  For anyone looking for data about names, they should look at ONOMAP (although, Onomap site is down at the time of writing).  An alternative data source might be Twitter.  If you filter the account name to leave only the ones with a proper 1st and 2nd name you can then investigate details about them such as when/where they tweet, now often they tweet and what they tweet about. However there are considerations about the base data that you have to be aware of.  It is not representative of the population as a whole. Twitter users fall into the 20-50 age bracket and users tend to be middle-classed. (I might add that while you can infer ethnicity from the twitter name, it tells you nothing about what the user considers them self to be, i.e British/not British). The final aspect that Longley presented was some initial investigations into what a name can tell you about class and background. For example, Ryan is the 6th most popular name for professional footballers but doesn’t appear in the Top 50 names of Oxford graduates (not sure where these data sets came from). I might add that it only costs £35 to change your name.

Longley also commented on the information that the Census was gathering and questioned if it was still collecting the information that analysists needed.  There is an increasing desire to know about the use of digital tech but this sector develops at such a rate that a 10 year sampling interval would not be appropriate.

Onto the first of the parallel sessions and a brief scan of the program suggested that it would be difficult to decide which stream to attend.   Rather than describe each presentation, I have grouped them together into topic themes.

Stats using R

Perhaps it shouldn’t have been a surprise that there were a lot of papers that used R.  There was a workshop on tuesday on the subject and Liverpool has a strong research group that use R as their stats tool of choice. Chris Brunsdon (Liverpool) outlined how easy it was to access data through API’s from R. The other nugget from Chris was that you could use R and Shiny to make web services, making your data interactive and allowing the user to perform some analysis over the web.  Certainly will be looking into these a bit further.

Mobile Mapping

There were a few presentations on mobile mapping apps.  Michalis Vitos (UCL) had created a pictorial based system that allowed illiterate users to record evidence of illegal logging in the Congo Basin. The app was stripped back to make it intuitive and easy for someone who may not be able to read or write to use.  Distances were estimated in terms of football pitches.  Michalis had used ODK Collect to build his app and initial tests in the field suggested that users could collect useful data through it.

EDINA showcased it’s new data collection app Fieldtrip GB which allows users to design and deploy data forms that meet the needs of their research.  Fieldtrip GB is free and is available for both iPhone and Android. Ben Butchart didn’t dwell much on the functionality of the app, choosing to explain some of the technical issues that had to be overcome by the development team.

Links

SpaceBook is a project that William Mackaness and Phil Bartie (University of Edinburgh) are involved in.  Essentially the idea is to provide information to a user about what they can see or about how to get to a place using visual aids and human interpretable instructions (target is to the left of the Scots Monument which is the tall tower directly ahead). The app adopts a speech based approach ensuring that the users hands are free to do other things such as take pictures.  The app has to make some assumptions to extract the users orientation but it would be interesting to try it out. Certainly, Edinburgh’s hilly terrain lends itself to such an app as the skyline changes as you rise and fall across the City.

Visualisation

Empires decline – Pedro Miguel Cruz

The second Keynote was given by Jason Dykes of City University London. Jason is well known for taking a dataset and presenting it in a novel way.  With an hour to fill, Jason took us through some of the more interesting projects that he has been working on and, as usual, he ran live demo’s changing parameters and re-generating the visualisations on-the-fly.  The first visualisation was from Pedro Cruz and it showed the decline of the Empires through time.  It starts with 4 large “blobs” and these slowly fragment into countries until we have a semi-recognisable world map. This would be great as a teaching aid in schools.

London Bike Hire Scheme – Map view

Other visualisations that are worth a look include the BikeGrid which takes feeds from the London Bike Scheme and allows you to view them as in a standard geographic layout and then a grid. The example for London works well as the river retains an element of geographic separation when the gridview is used.  This idea of being able to switch between geographic and non-geographic views can be taken further if you switch to a relationship view, where cluster of similar things are formed. In one example you could vary the amount of geographic control was exerted on the view and see whether or not geography was the reason for the relationship (i cant find the link to this at the moment).

London Bike Hire Scheme – Grid View

All the wiz-bang shown in Jason’s presentation is linked from his webpage. In addition, there are links to the giCentre’s utilities which should help anyone who is interested in using packages such as “Processing” to visualise data.

Other interesting things of note

There were a few other items that are worth mentioning that perhaps dont fit neatly into my hashed themes. One of these is Map-me.org, from Jonathon Huck, Lancaster University.  This site allows people to reate simple questionairs and then they can interact with a map to convey how strongly they feel about the topic using a “spray can” technique. The service is free and allows users to perform basic fuzzy geographic analysis through participatory science. The technique seems to lend itself well to applications such as locating new windfarms, or perhaps monitoring anti-social behavior in a neighbourhood.

Candela Sanchez discussed the Map Kibera project which saw slum communities map their neighbourhoods. Candela applied a similar approach to map the Shankar Maharaj Slum in India.  Candela looked at how easy it was to impliment the Kibera formula and what possible issues it threw up. The issues related to power, the local knowledge that slum dwellers had and the possibility that once mapped, the land could be “valued” and residents taxed or moved on by the landlords. Community buy-in and involvement throughout such projects is critical if they are to benefit the community itself.

Candela received the best “Open” paper award from OSGeo.  Phil Bartie won the overall best paper award.  GISRUK 2014 will take place in Glasgow.


Fieldtrip GB – A data capture app from EDINA

EDINA, the Jisc funded data centre based at the University of Edinburgh,  has just released an app that allows users to capture data against high quality base maps.  Fieldtrip GB has been designed to support teaching, learning and research in Great Britain. In summary, Fieldtrip GB:

  • is free to download and use
  • uses high quality background maps that offer rich data in both urban and rural environments
  • allows maps to be cached for off-network usage
  • enables data capture
  • includes the ability to create custom data collection forms that allow users to define the data they want to capture.

So what does it look like?

The app is split into 4 sections; Home, Maps, Capture and Download and Sync.   In addition there is a header which displays active elements such as the GPS/GPS tracking and a footer which allows quick navigation between the sections (Fig 1).

Fig 1 – Fieldtrip GB Home Screen

Quality Cartography

Part of the appeal of Fieldtrip GB is the mapping it uses.  The maps have been designed and optimised for a small screen making them ideal for viewing on a mobile phone. One of the challenges when creating the app was to ensure that the mapping worked in both urban and rural environments.  This is tricky as user will be looking for buildings, roads and road names in urban areas but users in rural areas may be more interested in features such as contour lines and rivers. Getting the highest zoom levels right was tricky but a new feature in Mapserver 6.2 allowed the developers to create an urban mask. Areas that were considered to be “urban” would display OS Street View data, whereas “rural” areas would display OS VectorMap District data augmented with OS Land-Form PANORAMA contours and path data from Natural England. In addition, considerable effort was made to place labels in sensible places, not an easy task when you need to automate the process for the whole country. Examples of the cartography are shown below (Fig 2)

Fig 2 – Examples of the mapping in Fieldtrip GB (left to right – Urban, Rural, Urban-Rural boundary)


Off-line maps

We understand that mobile data connectivity is not reliable in many areas of the country. Fieldtrip GB has been designed to allow users to download maps to their phones prior to going into the field. This way they will be available when data connectivity is not. There is the additional advantage that you can use WiFi to download the maps and not eat into your data allowance.

Capturing data doesn’t require a data connection.  You can collect data all day, or in fact all month, and then upload it all when you are able to connect to a strong WiFi signal.

Capture Data

There are two ways to capture data in Fieldtrip GB; by using one of the standard capture elements which support text, images, audio and GPS tracklog capture, or through the custom capture forms.

The custom capture forms are created through the Fieldtrip GB Authoring Tool. This is a website that allows users to design forms by dragging elements into an editor and defining the specific parameters they want to capture (Fig 3). We think this is where Fieldtrip GB really stands out as a useful research tool.  The Authoring Tool allows you to design data capture to meet your specific research aims. Custom data capture forms are uploaded to you Dropbox folder so that they can be accessed from your phone. To load them on your phone, just login and then perform a sync. This will grab any new forms from Dropbox  and save them to your phone.


Fig 3 – Overview of the Authoring Tool

Here’s an example of a form, in this case it is for collecting information about rocks (Fig 4). There is a drop down selector allow users to specify sedimentary, metamorphic or igneous rock types, sliders to record dip and strike, a note book reference and a photo capture option. Quite simple things, but easy to record and data will be consistent. We added a field-note Book ref so users could tie the digital record to their paper notes which might include specific details or a sketch.

Fig 4 – Example of a custom data capture form

Upload –> Edit –> Share

Once you have captured your data you can upload it to your Dropbox account and then either access it from there or view, edit and export it through the Authoring Tool (the authoring tool is so much more than an authoring tool).  In the authoring tool you can export the data from GPX format to other useful formats such as KML. You also have the option to share your maps with others. The Authoring Tool will mint a WMS of your data and provide you with a link embedded in your Dropbox folder, all you have to do is control who you share this link with.

What’s Next?

Well, the app is available for Android Devices and you can download it from the Google Play Store.  We have submitted it to the Apple iStore and are awaiting approval.  If all goes well this should take no more than a couple of weeks.

As for future versions and developments, we have a few features that we want to improve but what we really want is feedback from users. What would you like to see in the app?  What would you need to make this an indispensable tool for teaching and research.

 Take a look at the Fieldtrip GB website

Fieldtrip GB App

First of all – apologies for this blog going quiet for so long. Due to resource issues its been hard to keep up with documenting our activities. All the same we have been quietly busy continuing work on geo mobile activity and I’m please to announce that we have now releases our Fieldtrip GB app in the Google Play Store  

GooglePlayCapture

We expect the iOS version to go through the Apple App Store  in a few weeks.

Over the next few weeks I’ll be posting to blog with details of how we implemented this app and why we choose certain technologies and solutions.

Hopefully this will prove a useful resource to the community out there trying to do similar things.

A brief summary. The app uses PhoneGap and OpenLayers so is largely using HTML5 web technologies but wrapped up in a native framework. The unique mapping uses OS Open data including Strategi , Vector Map District  and Land-Form PANORAMA mashed together with path and cycleway data from OpenStreetMap and Natural England.

DSC02978screenshot-1363210183404
screenshot-1363210085080screenshot-1363210738430

SUNCAT Redevelopment: Technical architecture overview

Back in a post in November 2012 we announced that EDINA is redeveloping the existing SUNCAT search platform. We also gave you a preview of the new design and now we want to follow these posts up with more technical information about the new architecture.

New Search Platform

The cornerstone to the SUNCAT service is the ability to search for libraries’ MARC records and we wanted this to be as efficient as possible within the new architecture. We have therefore decided to use the open source enterprise search platform ‘Solr’ from the Apache Software foundation given its popularity and feature set.

We have established a workflow, which exports records from Aleph (currently used for loading and de-duplication of libraries’ serial records) and indexes these records within Solr.

The diagram below illustrates the process:

Individual MARC records are exported from Aleph and these are then grouped into MARC collections. A MARC collection consists of records from the libraries holding a particular serial.

These MARC collections are then indexed in Solr using a modified version of the open source solrmarc code.

Currently the Solr index consists of over 5 million individual library MARC records and in terms of storage sizes, this equates to over 30GB on disk.

New Interface

Storing all of the records in Solr however is only part of the new architecture. We are developing a new user interface for the SUNCAT service, taking the opportunity to also incorporate some new features that exploit the power of Solr.

A combination of the Java programming language, Groovy programming language and the Grails framework has been chosen as the software stack as it enables a rapid development process and also leverages the experience of developers within EDINA.

Grails follows the highly popular software design pattern of Model View Controller, which allows separation of concerns and a clean software design.

The following diagram illustrates at a very high level the architecture we are using and how Solr is involved:

We are developing a number of ‘controllers’, which are used to process user requests and issue queries to Solr as and when required. These controllers are designed for specific tasks e.g.

• Handling search requests

• Handling API requests

• Handling requests to view details of a specific MARC record etc.

We also have a number of templates that comprise the ‘views’ of the new system. When a controller has completed the processing of the user request and it is ready to return something to the user (e.g. a web page), it uses the relevant template and injects the correct data e.g. the search results. Using a template approach for all of the views of the system provides a huge amount of flexibility as we have full control of all visual aspects of the service and we can even support different output formats based on the user request e.g. supporting HTML, XML, JSON etc.

Enabling Searching at Library Level

We are also spending time in constructing a database to store institution, library and location data and integrating this within the new user interface in-order to allow users to perform more detailed searches within SUNCAT. For example searches can be performed at the library level whereas previously users could only search at the institutional level. We have also tagged every library with its GPS coordinates, which allows us to show all SUNCAT contributing libraries in a map interface and will allow proximity based searching in the forthcoming SUNCAT mobile application for iOS.

We will be keeping you up to date with more posts, about the redevelopment and the mobile app, to follow over the next few months.

Geospatial API’s and other tools for developers

Since the release of Open data back in 2010, and through the rise of mobiles and the App, the use of spatial data by developers has increased significantly.  Spatial data is no longer the preserve of the geospatial scientists, it is used by mainstream developers who see the value of location. I this post we will look at some of the “free” data and tools that you can use.

Data

OpenstreamAPI:

The Digimap OpenStream service provides access to a Web Map Service (WMS) offering Ordnance Survey OpenData products, including GB Overview, Miniscale, 1:250000 Colour Raster, VectorMap District Raster and OS Streetview.

EDINA aims to provide the latest version of OS OpenData via the OpenStream service. Once registered, you can use the Digimap OpenStream API to do things like:

  • Mashups, combining OS Opendata with maps and data from other sources.
  • adding OS Opendata to Google Earth.
  • Embed maps in your website.
  • provide OS mapping in your own applications.
  • provide OS mapping in a Desktop GIS project.

Openstream viewed in Google Earth

If you want to find out how to use Openstream please check out the folowing useful links:

Advantages – Free. Easy to use and provides regularly updated OS mapping. Available in OSGB and WGS1984 projections
Disadvantages – Not as easy to use in WGS84 as google maps, no satellite imagery available through API.

Google

Most people will be familiar with Google maps, specially if they have a smart phone. What can you say. Global cover (almost) and improving all the time. Packed with detail in urban areas. I suppose the weakness is in rural areas where detail may be sparse. Google maps is enough for many applications but if you may not be as accurate as the data from a national mapping agency, such as the OS.
Google maps is generally available for free in most cases. You have to pay if you use lots of data or if you want the data behind a login.

OpenStreetMap

OpenStreetMap is global community mapping project that wants to make a freely available map of the World. 10 years ago this would have been a crazy idea but today it is almost a reality. It suffers in the same way as Google maps in that it is great in urban areas and less good in rural areas. But, if the detail is not there, just sign up to the cause and add the detail yourself. Your edits will then be available for your, and everyone else’s, map.

Bing

Bing have a mapping stack that you can access through an API in a similar way to Google. Bing was quick to offer a bird’s eye view option for its satellite data and also has OS 1:50 000 mapping available as well as offering detailed street mapping for London. It is worth looking at the data available through the Bing Maps API as it is different to that offered by Google and may better suit your needs.

British Geological Survey

The BGS offer a number of Web Mapping Services (WMS) for developers and GUS users. These include 1:50 000 scale mapping, 1:625 000 mapping (on and offshore), 1:625 000 Hydrogeology, Soil data and contaminated land data. Full information on the use of these datasets and the GetCapabilities statements needed to access them is provided on the BGS website.

API Services

An Application Programming Interface (API) is a protocol intended to be used as an interface by software components to communicate with each other. An API is a library that may include specifications for routines, data structures, object classes, and variables. Thee are a number of API’s that give developers to spatial data and tools to create interactive web maps.

Unlock Text

Unlock Text is a powerful geoparser that can search text hosted on the web in .txt or .html format for references to locations. These locations are then returned ready for use in your results page, web map or any other application.

Unlock

Unlock Text is a RESTful API, you can use it by first setting up a username and password using the POST operation. You can use the GET operation to find out information about this account such as the number of Text documents that have been parsed. POST and GET operations can be used to set up new documents to be parsed and to retrieve the urls of results pages created by the parser.

You will need to use cURL commands; or a REST Console or Client which are available as add-ons for Chrome and Firefox web browsers, to use Unlock Text.

Advantages: Free! There is not really anything else out there to compete with it, unless you pay!

Limitations: Not always a perfect set of results, but then no one else does it perfectly either.  Wikipedia currently blocks it!

Unlock Places

Unlock Places is a place search web service, its API helps developers to find locations for place names. You can also use it to convert postcodes into coordinates, look up electoral boundaries, and to find shapes that overlap or intersect one another.

Unlock Places can provide geographic information describing places – or other features – as points (latitude-longitude coordinates) or larger bounding boxes and more detailed shapes (where possible).

Unlock Places can be used in your web project, app or mobile information service to add a geospatial location on to users’ data.

Advantages: Free

Limitations: Some searches can be a bit slow

National Library of Scotland

NLS

The NLS has a fantastic api which offers access to Historic Maps of the UK. Thus service is great and the mapping is based on out-of-copyright Ordnance Survey maps, dating from the 1920s to the 1940s. Full details of how to implement the map on a webpage or on a mobile app are available on the NLS website.

Google

Google has a host of API’s that allow developers to tap into tools and content delivered by Google. On the maps side of things, there is:

  • Google Maps JavaScripts API v3 – It provides you with the framework to add a number of unique features and content to a Google Maps interface and embed Google Maps in your own web pages. Version 3 of this API is especially designed to be faster and more applicable to mobile devices, as well as traditional desktop browser applications. The API provides a number of utilities for manipulating maps (just like on the http://maps.google.com web page) and adding content to the map through a variety of services. The JavaScript Maps API V3 is a free service, available for any web site that is free to consumers.
  • Mobile API and SDK – Google offers an Google Maps for Android API and a Native iOS SDK for Apple.  Both will allow developers access to google map content and functions such as titl, 3D buildings and Streetview.
The Google maps api has a free use cap of 750k maps a month.  If you think you will exceed this, then you can buy capacity.

Advantages: Google is by far the most popular API for mapping. The public are generally aware of Google Maps and are familiar with both the controls and the content. Mobile Friendly.
Disadvantages: Just because it is the most popular doesn’t mean that it will suit your needs. In particular, the level of details is patchy and may not provide your users with the richness that they need.  For example, you wouldn’t head off into the hills with Google Maps as your main navigational aid. Not entirely free.

Bing Maps API

Bing Maps API offers developers access most of the mapping and satellite images that are available through their main map site.

Bing Maps API as it is different to that offered by Google and may better suit your needs. Did i mention that Bing also does directions? Well it does for car, walking and public transport. The Bing api is has a free option but this has a usage cap and remove the birds-eye view function.  Education/not for profit accounts are available and commercial organisations can sign up to a range of service packages.

Advantages: Alternative mapping stack to Google API and similar user experience. Imagery pretty new.
Disadvantages: User community not as large as Google’s, not free.

Here API

Not heard of Here Maps API? Well Nokia is behind the Here API and that is a good start. Long before Google got serious about delivering spatial data to mobile phones, Nokia were supplying their handsets with mapping pre-loaded. OviMaps, as they used to be known, were pretty good and Nokia have developed them into the Here API service. The mapping is subtly different to Google and uses a pastel pallet that is easy on the eye. In addition to the cartography, there is also relief shaded Digital Terrain Models (DTM) and Maps 3D which is a bit like Google Earth but not quite as easy to use. However, there is a neat 3D option if you have a suitable screen and glasses. Free accounts are capped at 1 million map views a month, slightly higher than the google limit.
Mobile friendly version is available
Advantages: Clean cartography. Looks different to the usual maps. Mobile friendly api
Disadvantages: User community even smaller than Bing maps. Maps 3D not as intuitive as it could be. DTM has artifacts in it that may be annoying. Aerial Imagery not as up-to-date as Bing/Google. Not entirely free.

Openlayers

OpenLayers is an open source JavaScript library for displaying map data in web browsers. It provides an API for building rich web-based geographic applications similar to Google Maps and Bing Maps. OpenLayers is used by the OpenStreetMap project for its slippy map interface which is very similar to Google maps in terms of usability. OpenLayers is used in many web map interfaces including EDINA’s Digimap services.

OpenLayers

The nice thing about OpenLayers is that the user community is both large and very active. This means that you can usually find the answer to the questions that you have when developing an interface. In addition, there are plenty of example maps which allow you to view the code and therefore learn how to implement solutions quite simply.
From Version 2.10, OpenLayers supported built in Navigation and TouchNavigation. Other features such as Map Dragging and Pinch Zoom are also supported. provider the mobile browser support touch events.

Leaflet 

Leaflet

Leaflet is a modern open-source JavaScript library for mobile-friendly interactive maps. It is very similar in style and function to the Openlayers API. It has slightly less features than the Opnelayers API, however this has the advantage of possibly making the API more straightforward. The other biggest, or smallest, advantage that Leaflet has is it’s size. The library is a svelte 64K (Openlayers is over 700k).

One of the trickier aspects of Leaflet is using your own local projection, such as OSGB, rather than the standard Web Mercator.  If you want to do this, then i would suggest reading this blog post which documents the process.

Modest Map

To be added

Map Quest

To be added

Redevelopment of SUNCAT Platform

EDINA has embarked on a programme to redevelop the existing SUNCAT search platform. The impetus for this redevelopment emerged from a long held desire to not only provide enhanced functionality but also to be able to be more responsive to user feedback regarding suggested improvements.

Work commenced on the first phase of this development in spring 2012 as EDINA developers started to design and implement an entirely new bespoke user interface for the SUNCAT service.

In this initial development phase SUNCAT will continue to rely on Ex Libris’ Aleph software to load and de-duplicate contributing libraries’ serials records. The web interface however, will be developed in-house leveraging the open source enterprise search platform, Solr to facilitate highly efficient searching across the millions of SUNCAT records.

The developers considered a number of options to facilitate record searching, but Solr proved to be the best solution for dealing with the complex issues around searching and displaying records grouped into matched sets, a central component of the SUNCAT service. Moving to this open source platform should allow EDINA to have greater control and flexibility over the functionality and presentation of SUNCAT.

One key area of improvement, which will be available from the outset, is the ability to limit search results restricted to holdings from multiple libraries and locations. These limits will include all the individual locations of each of our contributing libraries, rather than just locations at an institutional level as with the current service. Another benefit will be that users will be able to select multiple locations and/or institutions to limit their search by, so giving them great flexibility. The limits will now also ensure that users only see the holdings from locations or institutions they are interested in, as any extraneous holdings will no longer be displayed. These improvements mean that in the future EDINA will be able to provide customised views onto the service, configurable at both the individual user level, and also at a higher geographic, subject specialist or consortial level.

The improvements to the geographic limits are particularly important for the mobile application which is also currently in development. EDINA conducted some early user testing with a small group of volunteers earlier in the year and it is hoped that a beta version will be made more widely available early in 2013.

Other key areas of new functionality will follow throughout the next year. The SUNCAT team have identified a wish list of features based on user feedback and also on a survey of some of the best functionality available in commercial search engines, library and union catalogues in the UK, Europe and beyond.

The feedback and survey also informed the design brief for the redeveloped service. Having considered a number of designs the SUNCAT team have narrowed the selection down to a few favoured options and we are currently consulting with our contributing libraries to decide on the final design.

It is hoped that a beta version of the new platform will be available in spring 2013, when we will be asking our users to provide feedback on progress. We hope that you will approve of the changes to come!

Augmented Reality View of AddressingHistory Now Available for iPhone, Android or Nokia Ovi Phone

We are extremely excited to let you know that you can now explore an “Augmented Reality” version of AddressingHistoryusing your iPhone or Android device. You can stand on a street in Edinburgh and see who used to live there!

How does it work?

The AddressingHistory layer works with the Layar App to compare information about your current location (from your phone) and the geo-referenced entries in AddressingHistory to work out which historical residents and businesses used to be located near where you are standing at that moment. These are displayed as “points of interest” – little icons that hover over the appropriate locations.

On your phone you will see these points of interest – historical people and places of business – overlaid on a live image from your camera. Moving the camera around lets you see historical addresses in all directions. Tapping on the resident brings up their record from AddressingHistory and will sometimes be illustrated with an icon representing the profession of that addressee.

Screenshot of the AddressingHistory Augmented Reality layer.

Screenshot of the AddressingHistory Augmented Reality layer.

Above is a screen capture of the view at night looking out of our offices but we will add some additional images to the website along with more information about how to use the layer shortly.

 It all sounds complicated but it’s actually very easy to use once you are all up and running.

How to Install 

To use the AddressingHistory Augmented Reality layer you will need to download and install the Layar App on a compatible iPhone, Android or Nokia phone.  Once you have done this and have opened the app you need to add the AddressingHistory layer as a favourite. To do this search for “Addressing History” within the App. Alternatively you can do directly to the layer page (http://www.layar.com/layers/buildar11124) as shown below:

Image of the Addressing History Layer download screen.

Image of the Addressing History Layer download screen.


QR code leading to the AddressingHistory Augmented Reality layer

Once you have added the AddressingHistory layer as a favourite you can start exploring the history of Edinburgh street by street – a perfect weekend activity!

The layer was built by the very talented EDINA software engineers using the buildAR tool. If you are interested in finding out more about the properly geeky parts of creating great geographic content for mobile phones then take a look at the occasional EDINA Mobile Geo blog.

Please do give the layer a try and let us know what you think – we think you’ll agree that this is a fantastic new way to browse AddressingHistory. We’d love to hear your feedback and experiences.

And if you think this is exciting…

Look out for another update from the AddressingHistory team very shortly with news of what we’ve been working on for the last few months…