Edinburgh Apps Final Pitch Event

This afternoon I’m at the EdinburghApps Final Pitch event, being held at the University of Edinburgh Informatics Forum. As usual for my liveblogs, all comments and edits are very much welcomed.

EdinburghApps, is a programme of events organised by Edinburgh City Council (with various partners) to generate ideas and technology projects addressing key social challenges. This year’s Edinburgh Apps event has been themed around health and social care (which have recently been brought together in Scotland under the Public Bodies Joint Working Bill for Health and Social Care Integration).

The event has run across several weeks, starting with an Inception weekend (on 6th & 7th Feb, which I blogged some of here), then a midway catch up/progress day (held on 27th Feb – you may have seen me tweet from this), and culminating in today’s final pitch event, at which we’ll hear from previous winners, as well as this year’s teams. The challenges they have been addressing around health and social care challenges fall under five headings (click to see a poster outlining the challenge):

Continue reading

Introducing the new MediaHub App for iPhone and iPad

Today we are very excited to announce the launch of the new MediaHub iOS App, which enables you to browse, search and save items on your iPhone, iPod Touch or iPad.

If you want to download the app and have an iOS device then head over to the App Store here. The app is free to download!

The MediaHub iOS App Featured screen for June/July 2015

The Featured screen in the MediaHub iOS App.

Who is the MediaHub App for?

The app is for any user of MediaHub based at a subscribing university or college and using an iOS device (an iPhone, iPod Touch or iPad/iPad Mini).

In order to provide you with the appropriate search, preview and bookmarking functionality the app is limited to those from institutions that support UK Federation login.

When you first download and set up the app you will be asked to login with your username and password. Once you have been logged in – which may take a few seconds – you are ready to go and you will remain logged for several months before you will be asked to reauthenticate. This helps ensure that our licensed content remains secure, without compromising the speed or ease of browsing through the app.

Is there an Android version?

We know that MediaHub users have or access a wide variety of mobile devices and we are currently building an Android App at the moment to ensure more of you have access to MediaHub whilst on the move. We expect the Android App to be available later this year.

What can you do with the app?

As the MediaHub App will be of most use when you are away from your laptop or desktop machine, rather than include the full range of functionality available on the web service, the app has been designed to enable you to search or browse for content on the go. Use it on your commute, when filling time between lectures or meetings, or when you get that great idea and want to quickly save an item to look at or include in your presentation later.

The app allows you to:

  • Browse featured content – the highlights from our collection which also appear on the front page of MediaHub.
  • Browse the most popular items – this is always an interesting and entertaining way to explore our content, as readers of our Most Popular blog posts will already be aware.
  • Search for MediaHub content – with the option to filter by format (video, image or audio), and to search external collections. You can also choose how your search results are ordered, by relevance, title or distance from a location – either your own current location or a location you have selected on a map.
  • Preview and view MediaHub items – including being able to watch videos in full (although we recommend that you do this via a wifi connection to minimise possible data charges).
  • Favourite MediaHub items for later use –  when you favourite an item in the app, it will also be added to your favourites list when you next login to the MediaHub service website. And similarly anything you have previously favourited in the service, will be synced to the app. So, you can search, browse, and select items whilst on the move, then download and edit into presentations, lecture notes, student projects, etc. when you are next editing these on your laptop or desktop machine.
  • Share MediaHub items – via email and phone messaging.

To give you an overview of the MediaHub App and how it works we have created the following user guide video:

Click here to view the embedded video.

How can I provide comments, questions or feedback on the app?

We welcome all of your comments and feedback on the MediaHub app, and on any aspect of MediaHub.

There are a few ways you can share your thoughts on the app:

Leave a comment and/or rating in the App Store

This will not only help us, but will also mean that your fellow MediaHub users hear your comments, constructive criticisms or top tips about the app. We would really appreciate your comments and ratings in the App Store as these can really help other new users to find the app, decide whether it is the right choice for them, and get an idea of how it is being used by others.

Leave a comment on this blog post

We will be keeping an eye out for comments and, like the App Store, any comment posted here will also benefit your fellow MediaHub users who may well have similar questions. We can then reply publicly  – and may update this post with new information as a result.

Join us for a Webinar!

To mark the launch of the MediaHub iOS App we will be holding several short webinars on the app, what you can do with it, and how you might use it in your teaching, learning or research. We welcome your comments during the webinars – or send in your question ahead of time and we will ensure it is included.

We regularly run MediaHub webinars and you are always welcome to participate and comment.

Contact us privately via the EDINA Helpdesk

If you would prefer to ask your question in a less public place, or have a very specific problem, question, etc. then you can contact the MediaHub team via the EDINA helpdesk: email: edina@ed.ac.uk or by phone: +44 (0)131 650 3302.

Who built the MediaHub App?

The app was built by the MediaHub team, based at EDINA. Not only did they build the app, they also baked a MediaHub App cake to celebrate its launch!

Image of the MediaHub team with celebratory cake

The MediaHub Team, from left to right: Catherine Fleming; Lorna Campbell; Mark Allan; Tim Stickland; Viv Mayo; Nicola Osborne; Niall Munro.

Where can I find the Terms and Conditions?

When you download the app you will be agreeing to the terms and conditions for the MediaHub App. You can read these in full via the App Store, and you can also read and save a copy from the link below. At login we ask you to agree to terms and conditions for Grapevine, the MediaHub bookmarking and personalisation service. You can read these in full via the link below. As with the web service, all use of MediaHub content must comply with the MediaHub Terms of Service.

If you have any questions about how to use the MediaHub App, the MediaHub service in general, or how to use any image, video or audio item that you have found through the app or service, please get in touch with our colleagues on the EDINA helpdesk, who will be happy to answer your questions. You can contact us via email: edina@ed.ac.uk or by phone: +44 (0)131 650 3302.

What does the MediaHub iOS App Look Like?

The screenshot at the beginning of this post, and the images below, give an ideas of how the app looks on an iPhone.

The MediaHub iOS App Search Settings screen

The MediaHub iOS App Search Settings screen

The MediaHub iOS App Search results screen

The MediaHub iOS App Search results screen

The best way to find out how the app looks and works is by using it! So, please do download the MediaHub iOS App, try it out, and let us know what you think!

GeoLocation in Learning and Teaching – LiveBlog

This afternoon I am attending, and supporting my colleague Tom, at the GeoLocation in Learning and Teaching event at the University of Edinburgh. This is an internal event arranged by the Social and Cloud based Learning and Teaching Service (http://edin.ac/1cHRslP). The event will be focusing on Geolocation technology used in learning and teaching at the University of Edinburgh.

We are kicking off with a brief introduction from Susie Greig to the day noting that “there does seem to be some interest in using GeoLocation in learning and teaching” – something definitely backed up by a very full room for this afternoon’s session!

Dr Hamish MacLeod, Senior Lecturer, Moray House School of Education– will be discussing the INGRESS game, he will describe the many rich features, and why he thinks they are (potentially) relevant to learning.

I think there are two real approaches to learning in gaming… One you might attribute to Marc Prensky – a kind of con folk into learning approach. I have much more sympathy for John Paul Gee’s take on gaming and learning.

I am talking about INGRESS, a mobile game (iOS and Android) but it is not a casual game, it requires proper engagement. It is a location dependent game – you have to get out there and use it in the world and it demands movement in the world. It is also an “exergame” – perhaps encourages exercise. It is an augmented relaity game, and alternate reality game, and it is open to users – you can contribute, interact, actively contribute to the game.

The game itself uses Google Maps as a basis, and the deceit of the game is that bright sparkly “portals” bring exotic matter to the world… and that exotic matter powers our scanner, our mobile phone… The object is to capture these portals and explore them. There are two factions in the game: green is the enlightened; the blue is the resistance…

The Enlightened is a faction attempting to help aliens called “Shifters” in the world. The Resistance are opposed to the Shifters presence in the world. Immediately shades of post modern theory…

Looking at a player profile you see a name, you see badges for achievements… and Google sits behind all of this… You can link your playing identity to your G+ profile (I haven’t).

The game is planet-wide – at least in terms of locations that are populated. My own neighbourhood is occupied by the enlightened faction… ! You can grab portals from your desk but the object is really to go further out, to explore the world…

The portals are not placed consistently, they tend to be associated with human objects… When you are proximal to a portal you can do various things… You can “hack” the portal to deploy objects useful in the game. You can deploy resonator or recharge it… Portals decay over time… You can also choose to attack portals… All of these portals have a physical existance… When one captures a portal, one finds out about the places one is moving around in… The information about the object the portal is focused on can be edited and added to… additional views can be included… If I really wanted some exercise, I would go up to Calton Hill… They will be less heavily defended because they are more remote than those in the city centre. Unclaimed portals are white… you use “resonators” to claim it… As a player I am level 6… that dictates what type/number of resonators I can deploy… I need other people to help me defend the portal… So there is a collaborative aspect whether you know who you are playing with or not…

There is a massive amount of media associated with the game: those announcing international events around the game; something that appears to be fan fiction, but managed by Google; and there is some back story about the game and the Shapers… Very rich media background to the game…

So, here, now… here is what one might do… Near here you will find a plaque to Clarinda, the name Burns used for Alice Macleroy who corresponded with him… There turns out to also be a plaque at the Carpet[I’ve misheard this] Tollbooth… Things you don’t know about the world around you…

From this game you can expose information, shapes to remember… puzzles and sequences to be echoed back to earn points… But these are not just arbitrary shapes, these are meaningful glyphs… Once we understand what they mean, they will read as meaningful or enigmatic sentences… A lovely illustration of George Meliores mystical number 7 in which we chunk information in order to process it better…

Here we see a (tweet) visualising a Christmas tree composed of links between portals… The two factions do compete in the game but this pattern is a massive act of collaboration and organisation to do this. There are halloween variants too… So the game is played at various levels, from casual to this sort of organised community…

We can add portals, and propose portals… It can take a while for portals to be vetted and recognised… I have managed to establish some… Including Hutton’s Rock on Salisbury Crags, and sites where core samples have been taken to find changes in the magnetic field over time… I’ve been systematic… and you could do that process, of creating portals.

You can also propose missions in the game – so there are missions around Scottish Enlightenment sites, The Royal Mile, Sir William Topaz McGonigall… So these user generated activities, projects… could be taken on to engage with resources in our environment that we wouldn’t usually engage with in that way…

Q&A

Q PW: This reminds me of Geo Caching, but this seems to have far more central control. Is that good or bad?

A HM: It is controlled by Google, of course it is providing them with many points of interest. Offers of suggestions can be slow to do… Geo Caching can be more controllable activity for a group of students to use though…

Q SG: Are you thinking of using this on your programme?

A HM: We are thinking about the Games Based Learning game… We use World of Warcraft there… But we look at designs of games for learning so it is interesting in that contact. But our degree is online and interestingly INGRESS really relates to shared geographical space – WoW is better in a lot of ways.. But you could work on the pattern making aspects.

Comment FH: It could be about time rather than location perhaps…

A HM: To play with this in a geographically colocated group would be interesting, might be other uses entirely for a distributed group of learners…

Q TF: If I want students to learn about, say, medical education could I map it onto this game – or another – or does the game need to change?

A HM: You could have a walking tour of Edinburgh highlighting medical locations, historical dimensions and people associated with that… It might be forced or less forced depending on what you want to achieve

Comment COS: It might be fun for orientation sessions for colocated students.

Tom Armitage, Geoservices Support, EDINA –  will present on the mobile mapping and data collection app Fieldtrip GB.

I’m talking about FieldTrip GB, but firstly I just wanted to tell you a bit about what we do. We are a Jisc Supported National Datacentre providing services, data, support, etc. Our work covers geospatial services, reference, multimedia, access areas and tools including FieldTrip GB. Digimap is our main geospatial service, we run GoGeo that allows you to search for geospatial data and create and share your own metadata records via GeoDoc – ideal for sharing geospatial research data. We have Unlock which lets you create geospatial search tools, or to georeference your own text. We also have OpenStream which allows you to stream open data from Ordnance Survey into websites/GIS. Finally FieldTrip GB which lets you gather data in the field.

We also have projects: AddressingHistory georeferenced historical Post Office Directories; we are involved in Trading Consequences and Palimpsest projects, both about geoparsing documents and visualising that; Spatial Memories helped visually impaired learners to navigate the world through a mobile app; and finally the COBWEB project which is a large FP7-funded project with many aspects that link into data collection and citizen science.   

So, FieldTrip GB was about bringing some key fields to mobile. To be able to capture images, audio, text, location. To be able to use high quality background maps, and to be able to save maps for use “offline”. It allows you to do custom data collection forms, and to then access that form and collect data via your phone or tablet – it is available for Apple iOS devices or Android devices.

The main screen of the app lets you view online or saved maps, to capture data – both forms and GPS tracking. And the Download button lets you download mapping for use online. Login is via Dropbox… We chose Dropbox because it is free, the terms of use don’t give Dropbox access to users data – preferable to other services. And that also means the data is the property and responsibility of the user. And you can also potentially share Dropbox details to enable crowd sourcing…

So, the powerful bit of FieldTrip GB is the authoring tool… You can drag and drop different types of data capture into a form – text fields, multiple choice questions, ranges to select from, drop down menus, image capture, etc… You can drag and drop these items in, you can label and set limits/labels/choices as you wish. As soon as that is saved, it can be accessed from the app on your phone/tablet… And anyone with that Dropbox login can go in and use that form and submit data…

Those custom forms allow for easy data  management – consistent terms, single data structure, setting increments to aid estimates, reduced errors (or consistent at least!). Once you fill in a form, you click save.. and then you get to locate your data. Shown as a point on the map based on where you are standing. You can move that pin as needed, you can manually correct where the form things you are…

A wee bit about the mapping… We have combined OS OpenData, added contour mapping from other open sets of maps, brought in Open Street Maps, so we have a custom stack of high quality mapping for the UK, built on all open data sources… We have two different maps at the same scale – one is better in urban areas, one better for rural areas, so you see the appropriate mapping in the area you are in (may combine these in light of new data available openly from the Ordnance Survey).

The advantage of offline mapping is that it saves on cost in urban areas, and allows access in rural areas where there may not be internet access of any type. And everything cached loads faster too!

So, you go out, you collect data… You then can go back to the authoring tool to view data, to filter it, browse the data, edit or delete records if you need to, by uploader (if you include that in your form), to download/export it as kml, GeoJson, csv, wms. You can also share maps through Dropbox. GeoJson is good for embedding maps into websites. KML opens up in Google Earth – looks beautiful!

We’ve put together a vague practical lesson plan that you could use with a class… You set up a Dropbox account that you are happy to share. You download FTGB, you design your form, you share the form – and encourage downloading of maps, in the field you then collect the data using the form, you get back you get online and upload your forms/results, you go into the authoring tool and filter as needed (e.g. incomplete forms), then you can export your data and view them in your choice of whatever tools.

In the future release we will be releasing a global edition, based on OpenStreetMap. It will work the same way but with different background mapping. We may also be supporting upload of your own maps to use as a basemap when you are out collecting data. Similarly points of interest/waymarkers. Also extra sensor measurements – phone as a compass for instance, maybe also ambient noise via microphones. Potentially also more complex forms… we have had requests for logic to change later questions based on a form… All to come in future versions!

Q&A

Q: Some of those extra features – your own maps, waymarkers, OSM – would be really useful.

A TA: Would be great to hear that from your as evidence for those developments.

Q: YOu talked about Dropbox, have you considered OneDrive which the university now has access to.

A TA: Yes, we built it to feed into any cloud storage provider… We started with Dropbox and have stuck with because it is most flexible

Comment NO: We are using FTGB in COBWEB, so we are self hosting rather than using Dropbox, also using access management.

Q JS: Can you embed images in the app for users to use to identify what they are seeing? e.g. an image of a tree.

A TA: YEs, also looked at in COBWEB, also dichotomous trees… Will all come, probably as part of the COBWEB development.

Dr. Anouk Lang, Lecturer in Digital Humanities, School of Literatures, Languages and Cultures will discuss how she uses the SIMILE Exhibit platform, which runs off the Google Maps API, to create an interactive map to use with students to explore the literary culture of Paris in the 1920s.

I’ll be showing you a site I have built (see: http://aelang.net/projects/) using SIMILE Exhibit, using Google Maps. This is a map of Paris with information related to literature in Paris. Paris was a particularly important place for anglophone modernism – lots of Americans moves there – Stein, Joyce, Fitzgerald, and that decade was so important to modernism. The histories of this time are concerned with a linear narrative. When we see a map it is very seductive… But that is a representation, not accurate. But I was particularly keen to map those places that matter… It can be hard to understand the role of spatiality of the places in this movement (or indeed in general).

So, in this tool you can explore by person… So you can for instance view Sylvia Beech’s life, a book seller central to modernism in that time. Clicking on a place gives you more information about that place, it’s relevance.

So, how do you build this? You have a script that is free to use. You enter data into a Google Spreadsheet… There are some predefined fields here… I put in bibliographic reference to allow me to use it in teaching. I put in a person as I am interested in the social links within modernism. The reason I like this is taht in the humanities is that we aren’t really trained to use GIS, but a spreadsheet we can just about manage!

So the data is piped in from a Google spreadsheet, but you have to build the front end. I found a guide from Brian Croxall will walk you through the process – you can use his JavaScript and tinker with it…. So you get it up and running…

I originally built this for teaching. The 1920s wasn’t recognised as important until much later on 1950s/60s/70s. By then it is clear, in the biographies, who the big important players are. And those who never quite published that master work etc, insert themselves into that history. For instance we have Canadian writers (e.g. Morley Hallaghan, the only person to knock out Ernest Hemingway) who have interesting interactions with the big players. John Glassco’s Memoirs of Montparnasse, documents his bisexual adventures with both male and female writers of this tine… He locates himself close to key locations… But he has a rival, Morley Hallaghn… So he mentions meeting him but never assigns the location/space there… It sheds a whole new life in their relationships that would have been invisible if I’d looked at those works in any other way… mapping their locations was so useful.

Now I built this for research, but it does double duty for teaching. It is a framework for research, but I got students to think about sociality of modernism in Paris. I asked them to find one piece of information relevant to modernism, arts, culture in Paris, and to find the Geolocation associated with that person – the details are often vague in biographies and texts. That task took them a long time… Then the students were given access to the spreadsheet… So you can then see those entries, and visualise them on that map… And we were able to see patterning of which writers stayed where. So you can explore the locations of women versus those of men. So Paris in the 20s had a group of unusually strong women, publishing each others work… so where did they hang out? That concept is in play… That cotidillon sense of our everyday place actually shaped literary history. Place is such an interesting lens through which to consider this work. We may only have sparse information of where these people live and stay – and we may have location only for months or a few years… raises useful questions, lets us ask critical things… Mapping this stuff perhaps helps you see biases, particularly around the prominence of particular places versus others.

So, students begin to understand the research process… you have contingent data that you need to make an arguement out of.

Something I love about the Digital Humanities is the sense and culture of openness… And when you teach there is a commitment among the best teachers in this subject to share the very best students work online. That makes students very aware of this very public process – they are very serious about, it is their reputation on the line/building up, and a thing to point employers and peers, etc. to in the future…

So, we build this stuff… We need to embed it so students have to learn a snippit of HTML. Students also learn the importance of precision. If students use “1920′s” rather than “1920s” will hide their work in the faceted search. It seems like a tiny thing but in this subject changes in punctuation can be so important – whether in student work or in those writing on Emily Dickenson’s work.

The other thing that this was helpful for was bibliographic referencing… They were expected to get a proper reference… As we clicked in things in class I mentioned errors… As I did that students were editing their own references live in response. The publicness of the sharing made them keen to correct things! I also really like the serendipity of this – and other new tools – in teaching.

I should say that you can’t do spatial analysis in this. But the SIMILE Exhibit tools do let you view a timeline (and click for more data). But the map is  a point map, I would pull the data out and put it into Arc GIS to do serious spatial analysis on this data… So looking for the shapes, comparing literary to tourist areas for instance.

So, if you want to play, I have a sand box. Find it at: http://aelang.net/projects/canada.htm, just email Anouk for access. If you do edit, do include an identifier to ensure you can identify your own entries – and view just those points on the map.

Q&A

Q: Will you put in iTunes?

A Anouk: Will I make it an app? No. Firstly Google Maps Engine is going, so need to move to OSM. But also not what I need for my students!


Programme

Duncan Shingleton, Research Assistant/Technician, School of Design will presentation on various location based research projects Design Informatics has done:

Walking though time – negotiating the streets of Edinburgh in 1860

Comob – Networking people movements

GoGet – Objects hitch hiking on the path of humans

Treasure Trapper – Mobile game in conjunction with Edinburgh Museum and Galleries.

Mr Seels Garden – Food narratives in the city

Ghost Cinema – cinematic narratives in battersea


Jonathan Silverton Chair in Technology Enhanced Science Education in the School of Biological Sciences – will present on “Virtual Edinburgh: turning the whole city into a mobile learning environment”

Share/Bookmark

GoGeo Mobile has been released

The GoGeo Mobile iPhone App was created bgogeoAppy EDINA at the University of Edinburgh to support teaching, learning and research.
Jisc provided support for the GoGeo App project as part of its commitment to encourage the use of new and emerging technology to support research and learning in the UK.

GoGeo Mobile is an app that allows users to keep abreast of news and events in the geospatial sector. GoGeo Mobile is separated into a number of channels including News, Events, Jobs and Resources for Teachers. Each channel contains useful and relevant resources for anyone working with Geographic Information Systems (GIS), Remote Sensing or spatial data.

In addition, GoGeo Mobile allows users to perform targeted searches for spatial data. Searches can be defined by keyword and/or location and return a brief description of the data and users can then forward themselves a direct URL to the metadata record so they can download the data when they are back at their desk.

Compatibility: Requires iOS 7.0 or later. Compatible with iPhone, iPad, and iPod touch. This app is optimised for iPhone 5, iPhone 6, and iPhone 6 Plus.

You can download the GoGeo Mobile App from the UK iTunes App Store.

Please provide Feedback to edina@ed.ac.uk with GoGeo App in the subject field.

Google Glass at the University of Edinburgh

Hands free, voice activated and designed to be an unobtrusive as possible, Google Glass is one example of how wearable technology is changing how we think about mobile technology.

The University, in partnership with Google, has embarked on a project investigating how this technology can be used to support learning, teaching and the general day to day experience at the University.

To this end, the University is encouraging small groups (Max 4) to submit ideas of how this technology can be used; the key words are innovation and creativity.

There is a website (http://glass.ed.ac.uk/) that has further details regarding the project.

EDINA Geo Services at GeoDATA London Showcase 2014

Early this month, EDINA Geodata Services held an exhibit at the GeoDATA Showcase 2014 event in London. This was our second time to exhibit at this event which is aimed primarily at the commercial end of the GI industry covering current data and technology topics. This follows on from other events in the series as described previously on the GoGeo Blog.

A summary of the talks can be found online.

We had a small stand, but the positive responses we got from visitors was very encouraging: from students who are currently using Digimap in their studies, to the lecturer in a university who said that Digimap was a great resource and essential to his teaching. Even more encouraging was the number of delegates and staff on other stands, with successful careers in the GI industry, who came up and said that they had used Digimap during their studies and it was a vital to their degree. It’s good to know that the future generations in the GI industry have the expectation that they will have easy access to high quality geospatial data, readily available from Digimap (at least while they are in education!).

We talked to delegates from a wide range of industries including environmental consultancies, government, data providers, local councils, defence and education as well as visiting and talking to many of the other exhibitors. We got a lot of useful feedback on what we’re doing and ideas for what we could be doing in the future including potential opportunities for collaboration. Of particular interest to delegates was the Fieldtrip GB app we were demonstrating which is a mobile data collection platform – especially once the magic word ‘free’ was mentioned, and also that there is an Open version available on Github.

Mince pies and mulled wine near the end were a welcome break from a long day, so busy that we didn’t actually get a chance to attend any of the talks, many of which looked very interesting, however it was a very useful event to attend. We look forward to next year’s event on the 3rd December 2015.

Creating a transparent overlay map with mapbox-ios-sdk

For this blog post i have managed to capture on of EDINA’s mobile developers.  Their guest article will describe how to create transparent overlays for mobiles using mapbox-ios-sdk.

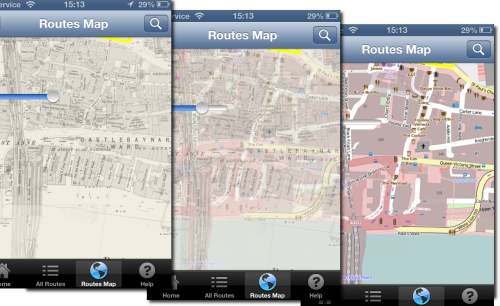
I am working on a historic map overlay, where the user can adjust the transparency of the historic map. The user can then see the how the land use has changed over time by using the slider.

opacity-map-overlay

I am going to use the map-box fork of route me. Looks like a good bug fixed version of Route-me and map-box do seem to have great some great products.

Unfortunately it doesn’t have an have an API to dynamically change the opacity of a tile source out the box. So I added it.

Its pretty easy to add. Each tileSource has a RMMapTileLayerView container when added to the map. Within that can manipulate the CALayer.opacity to get the desired effect.

I added a fork to github for testing

https://github.com/murrayk/mapbox-ios-sdk/

And example of use – the code is in github. Do a ‘git clone –recursive’ to install the submodules.

https://github.com/murrayk/mapbox-overlay-opacity-example

And example of use. In the  main view controller.

- (void)viewDidLoad
{
    [super viewDidLoad];
        // Do any additional setup after loading the view, typically from a nib.
    RMOpenStreetMapSource * openStreetMap = [[RMOpenStreetMapSource alloc] init];
    RMGenericMapSource * weatherMap = [[RMGenericMapSource alloc] initWithHost:@"tile.openweathermap.org/map/clouds" tileCacheKey:@"cloudCover" minZoom:0 maxZoom:18];

    self.mapView.tileSource = openStreetMap;

    [self.mapView addTileSource:weatherMap];

    self.overlay = weatherMap;
    // rough bb W = -30.0 degrees; E = 50.0 degrees; S = +35.0 degrees; N = +70.0 degrees
    NSLog(@"zooming to europe");
    CLLocationCoordinate2D northEastEurope = CLLocationCoordinate2DMake(70,-30);
    CLLocationCoordinate2D southWestEurope= CLLocationCoordinate2DMake(35,50);
    [self.mapView zoomWithLatitudeLongitudeBoundsSouthWest:southWestEurope northEast:northEastEurope animated:YES];

    [self.mapView setOpacity:0.5 forTileSource: self.overlay];

}

//hook up a slider to manipulate the opacity.  

- (IBAction)changeOverlayOpacity:(UISlider *)sender {

    NSLog(@"Slider value changed %f", sender.value );
    [self.mapView setOpacity:sender.value forTileSource: self.overlay];
}
If you found this blog useful, you might want to look through the archived articles on EDINA’s developers Geo-Mobile blog


Creating a transparent overlay map with mapbox-ios-sdk.

I am working on a historic map overlay, where the user can adjust the transparency of the historic map. The user can then see the how the land use has changed over time by using the slider.

opacity-map-overlay

I am going to use the map-box fork of route me. Looks like a good bug fixed version of Route-me and map-box do seem to have great some great products.

Unfortunately it doesn’t have an have an API to dynamically change the opacity of a tile source out the box. So I added it.

Its pretty easy to add. Each tileSource has a RMMapTileLayerView container when added to the map. Within that can manipulate the CALayer.opacity to get the desired effect.

I added a fork to github for testing

https://github.com/murrayk/mapbox-ios-sdk/

And example of use – the code is in github. Do a ‘git clone –recursive’ to install the submodules.

https://github.com/murrayk/mapbox-overlay-opacity-example

And example of use. In the  main view controller.

- (void)viewDidLoad
{
    [super viewDidLoad];
        // Do any additional setup after loading the view, typically from a nib.
    RMOpenStreetMapSource * openStreetMap = [[RMOpenStreetMapSource alloc] init];
    RMGenericMapSource * weatherMap = [[RMGenericMapSource alloc] initWithHost:@"tile.openweathermap.org/map/clouds" tileCacheKey:@"cloudCover" minZoom:0 maxZoom:18];

    self.mapView.tileSource = openStreetMap;

    [self.mapView addTileSource:weatherMap];

    self.overlay = weatherMap;
    // rough bb W = -30.0 degrees; E = 50.0 degrees; S = +35.0 degrees; N = +70.0 degrees
    NSLog(@"zooming to europe");
    CLLocationCoordinate2D northEastEurope = CLLocationCoordinate2DMake(70,-30);
    CLLocationCoordinate2D southWestEurope= CLLocationCoordinate2DMake(35,50);
    [self.mapView zoomWithLatitudeLongitudeBoundsSouthWest:southWestEurope northEast:northEastEurope animated:YES];

    [self.mapView setOpacity:0.5 forTileSource: self.overlay];

}

//hook up a slider to manipulate the opacity.  

- (IBAction)changeOverlayOpacity:(UISlider *)sender {

    NSLog(@"Slider value changed %f", sender.value );
    [self.mapView setOpacity:sender.value forTileSource: self.overlay];

}

Fieldtrip GB – Mapserver 6.2 Mask Layers

By Fiona Hemsley-Flint (GIS Engineer)

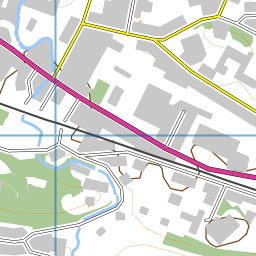
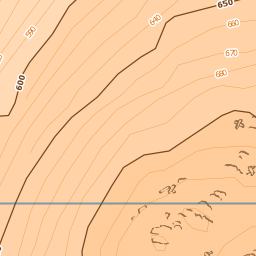
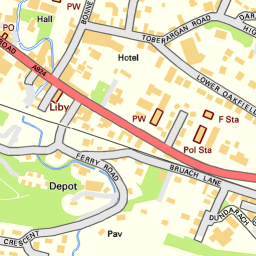
Whilst developing the background mapping for the Fieldtrip GB App, it became clear that there was going to have to be some cartographic compromises between urban and rural areas at larger scales; Since we were restricted to using OS Open products, we had a choice between Streetview and Vector Map District (VMD) – Streetview works nicely in urban environments, but not so much in rural areas, where VMD works best  (with the addition of some nice EDINA–crafted relief mapping) . This contrast can be seen in images below.

streetview1VectorMapDistrict1

Streetview (L) and Vector Map District (R) maps in an urban area.

streetview2VectorMapDistrict2

Streetview (L) and Vector Map District (R) maps in a rural area.

In an off-the-cuff comment, Ben set me a challenge – “It would be good if we could have the Streetview maps in urban areas, and VMD maps in rural areas “.

I laughed.

Since these products are continuous over the whole of the country, I didn’t see how we could have two different maps showing at the same time.

Then, because I like a challenge, I thought about it some more and found that the newer versions of MapServer (from 6.2) support something called “Mask Layersâ€�  – where one layer is only displayed in places where it intersects another layer.

I realised if I could define something that constitutes an ‘Urban’ area, then I could create a mask layer of these, which could then be used to only display the Streetview mapping in those areas, and all other areas could display a different map – in this case Vector Map District (we used the beta product although are currently updating to the latest version).

I used the Strategi ‘Large Urban Areas’ classification as my means of defining an ‘Urban’ area – with a buffer to take into account suburbia and differences in scale between Strategi and Streetview products.

The resulting set of layers (simplified!) looks a bit like this:

masking example

Using Mask layers in MapServer 6.2 to display only certain parts of a raster image.

Although this doesn’t necessarily look very pretty in the borders between the two products, I feel that the overall result meets the challenge – in urban areas it is now possible to view street names and building details, and in rural areas, contours and other topographic features are more visible. This hopefully provides a flexibility  for users on different types of field trips to successfully implement the background mapping.

Here’s a snippet of the mapfile showing the implementation of the masking, in case you’re really keen…

#VMD_layer(s) defined before mask

LAYER

…..

END

#Streetview mask layer

LAYER

NAME “Streetview_Mask”

METADATA

…..

END

#Data comes from a shapefile (polygons of urban areas only):

DATA “streetview_mask”

TYPE POLYGON

STATUS OFF

END

#Streetview

LAYER

NAME “Streetview”

METADATA

…..

END

#Data is a series of tiff files, location stored in a tileindex

TYPE Raster

STATUS off

TILEINDEX “streetview.shp”

TILEITEM “Location”

#*****The important bit – setting the mask for the layer*****

MASK “Streetview_Mask”

POSTLABELCACHE TRUE

END

Follow Up Post: Crowdsourcing Your Neighbourhood

Following my post earlier this month on the Cabaret of Dangerous Ideas event which myself and my colleagues Addy and Ben ran on Fieldtrip GB, I am delighted to have some additional follow up.

The main reason for this follow up is because Eccentronic have created a fantastic and, in their words, “quite bizarre”  video using the map of public toilets we created specially for our event using Fieldtrip GB. Watch it in all of it’s glory here:

Click here to view the embedded video.

Do let Eccentronic know what you think – comment or like the video over on YouTube, tweet them @eccentronic, or leave comments below.

Now, this is definitely the most creative response I’ve seen to Fieldtrip GB… so far! I’m hoping it’s the start of many weird and wonderful uses of the app! On that note do share your own thoughts on our key question from the event :

If you could map anything in your community, what would it be and why?

here, in the comments below.

And the other goodies to share…

The Edinburgh Beltane Network – who were coordinating the Cabaret of Dangerous Ideas events with Susan Morrison – have now set most of the images from the very varied Cabaret of Dangerous Ideas events live here on Flickr.

Addy Pope speaking to the small audience at the Cabaret of Dangerous Ideas

Addy Pope speaking at our Cabaret of Dangerous Ideas event.

This leaves only the audio file from our event. If it is sounds reasonable we will share it via an update to this post so bookmark this post and keep an eye out!

Share/Bookmark