Today we have our second eLearning@ed/LTW Showcase and Network event. I’m liveblogging so, as usual, corrections and updates are welcome.Â
Jo Spiller is welcoming us along and introducing our first speaker…
Dr. Chris Harlow – “Using WordPress and Wikipedia in Undergraduate Medical & Honours Teaching: Creating outward facing OERs”
I’m just going to briefly tell you about some novel ways of teaching medical students and undergraduate biomedical students using WordPress and platforms like Wikipedia. So I will be talking about our use of WordPress websites in the MBChB curriculum. Then I’ll tell you about how we’ve used the same model in Reproductive Biology Honours. And then how we are using Wikipedia in Reproductive Biology courses.
We use WordPress websites in the MBChB curriculum during Year 2 student selected components. Students work in groups of 6 to 9 with a facilitator. They work with a provided WordPress template – the idea being that the focus is on the content rather than the look and feel. In the first semester the topics are chosen by the group’s facilitator. In semestor two the topics and facilitators are selected by the students.
So, looking at example websites you can see that the students have created rich websites, with content, appendices. It’s all produced online, marked online and assessed online. And once that has happened the sites are made available on the web as open educational resources that anyone can explore and use here:Â
http://studentblogs.med.ed.ac.uk/The students don’t have any problem at all building these websites and they create these wonderful resources that others can use.
In terms of assessing these resources there is a 50% group mark on the website by an independent marker, a 25% group mark on the website from a facilitator, and (at the students request) a 25% individual mark on student performance and contribution which is also given by the facilitator.
In terms of how we have used this model with Reproductive Biology Honours it is a similar idea. We have 4-6 students per group. This work counts for 30% of their Semester 1 course “Reproductive Systems” marks, and assessment is along the same lines as the MBChB. Again, we can view examples here (e.g. “The Quest for Artificial Gametes”. Worth noting that there is a maximum word count of 6000 words (excluding Appendices).
So, now onto the Wikipedia idea. This was something which Mark Wetton encouraged me to do. Students are often told not to use or rely on Wikipedia but, speaking a biomedical scientist, I use it all the time. You have to use it judiciously but it can be an invaluable tool for engaging with unfamiliar terminology or concepts.
The context for the Wikipedia work is that we have 29 Reproductive Biology Honours stduents (50% Biomedical Sciences, 50% intercalculating medics), and they are split into groups of 4-5 students/groups. We did this in Semester 1, week 1, as part of the core “Research Skills in Reproductive Biology”. And we benefited from expert staff including two Wikipedians in Residence (at different Scottish organisations), a librarian, and a learning, teaching and web colleague.
So the students had an introdution to Wikipedia, then some literature searching examples. We went on to groupwprl sesssions to find papers on particular topics, looking for differences in definitions, spellings, terminology. We discussed findings. This led onto groupwork where each group defined their own aspect to research. And from there they looked to create Wikipedia edits/pages.
The groups really valued trying out different library resources and search engines, and seeing the varying content that was returned by them.
The students then, in the following week, developed their Wikipedia editing skills so that they could combine their work into a new page for
Neuroangiogenesis. Getting that online in an afternoon was increadibly exciting. And actually that page was high in the search rankings immediately. Looking at the traffic statistics that page seemed to be getting 3 hits per day – a lot more reads than the papers I’ve published!
So, we will run the exercise again with our new students. I’ve already identified some terms which are not already out there on Wikipedia. This time we’ll be looking to add to or improve High Grade Serious Carcinoma, and Fetal Programming. But we have further terms that need more work.
Q&A
Q1) Did anyone edit the page after the students were finished?
A1) A number of small corrections and one querying of whether a PhD thesis was a suitable reference – whether a primary or secondary reference. What needs done more than anything else is building more links into that page from other pages.
Q2) With the WordPress blogs you presumably want some QA as these are becoming OERs. What would happen if a project got, say, a low C.
A2) Happily that hasn’t happened yet. That would be down to the tutor I think… But I think people would be quite forgiving of undergraduate work, which it is clearly presented at.
Q3) Did you consider peer marking?
A3) An interesting question. Students are concerned that there are peers in their groups who do not contribute equally, or let peers carry them.
Comment) There is a tool called PeerAim where peer input weights the marks of students.
Q3) Do all of those blog projects have the same model? I’m sure I saw something on peer marking?
A3) There is peer feedback but not peer marking at present.
Dr. Anouk Lang – “Structuring Data in the Humanities Classroom: Mapping literary texts using open geodata”
I am a digital humanities scholar in the school of Languages and Linguistics. One of the courses I teach is digital humanities for literature, which is a lovely class and I’m going to talk about projects in that course.
The first MSc project the students looked at was to explore Robert Louis Stevenson’s The Dynamiter. Although we were mapping the texts but the key aim was to understand who wrote what part of the text.
So the reason we use mapping in this course is because these are brilliant analytical students but they are not used to working with structured data, and this is an opportunity to do this. So, using CartoDB – a brilliant tool that will draw data from Google Sheets – they needed to identify locations in the text but I also asked students to give texts an “emotion rating”. That is a rating of intensity of emotion based on the work of Ian Gregory – spatial historian who has worked with Lakes data on the emotional intensity of these texts.
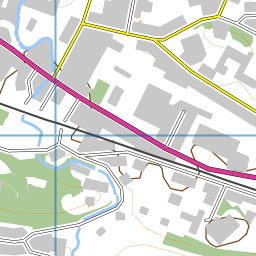
So, the students build this database by hand. And then loaded into CartoDB you get all sorts of nice ways to visualise the data. So, looking at a map of London you can see where the story occurs. The Dynamiter is a very weird text with a central story in London but side stories about the planting of bombs, which is kind of played as comedy. The view I’m showing here is a heatmap. So for this text you can see the scope of the text. Robert Louis Stevenson was British, but his wife was American, and you see that this book brings in American references, including unexpected places like Utah.
So, within CartoDB you can try different ways to display your data. You can view a “Torque Map” that shows chronology of mentions – for this text, which is a short story, that isn’t the most helpful perhaps.
Now we do get issues of anachronisms. OpenStreetMap – on which CartoDB is based – is a contemporary map and the geography and locations on the map changes over time. And so another open data source was hugely useful in this project. Over at the National Library of Scotland there is a wonderful maps librarian called Chris Fleet who has made huge numbers of historical maps available not only as scanned images but as map tiles through a Historical Open Maps API, so you can zoom into detailed historical maps. That means that mapping a text from, say, the late 19th Century, it’s incredibly useful to view a contemporaneous map with the text.
So, moving to this year’s project… We have been looking at Jean Rhys. Rhys was a white Creole born in the Dominican Republic who lived mainly in Europe. She is a really located author with place important to her work. For this project, rather than hand coding texts, I used the wonderful wonderful Edinburgh Geoparser (https://www.ltg.ed.ac.uk/software/geoparser/??) – a tool I recommend and a new version is imminent from Clare Grover and colleagues in LTG, Informatics.
So, the Geoparser goes through the text and picks out text that looks like places, then tells you which it things is the most likely location for that place – based on aspects like nearby words in the text etc. That produces XML and Clare has created me an XSLT Stylesheet, so all the students have had to do is to manually clean up that data. The GeoParser gives you GeoNames reference that enables you to check latitude and longitude. Now this sort of data cleaning, the concept of gazeteers, these are bread and butter tools of the digital humanities. These are tools which are very unfamiliar to many of us working in the humanities. This is open, shared, and the opposite of the scholar secretly working in the librarian.
We do websites in class to benefit from that publicness – and the meaning of public scholarship. When students are doing work in public they really rise to the challenge. They know it will connect to their real world identities. I insist students sow their name, their information, their image because this is part of their digital scholarly identities. I want people who Google them to find this lovely site with it’s scholarship.
So, for our Jean Rhys work I will show you a mock up preview of our data. One of the great things about visualising your data in these ways is that you can spot errors in your data. So, for instance, checking a point in Canada we see that the Geoparser has picked Halifax Nova Scotia when the text indicates Halifax in England. When I raised this issue in class today the student got a wee bit embarrassed and made immediate changes… Which again is kind of perk of work in public.
Next week my students will be trying out QGIS Â with Tom Armitage of EDINA, that’s a full on GIS system so that will be really exciting.
For me there are real pedagogical benefits of these tools. Students have to really think hard about structuring their data, which is really important. As humanists we have to put our data in our work into computational form. Taking this kind of class means they are more questioning of data, of what it means, of what accuracy is. They are critically engaged with data and they are prepared to collaborate in a gentle kind of way. They also get to think about place in a literary sense, in a way they haven’t before.
We like to think that we have it all figured out in terms of understanding place in literature. But when you put a text into a spreadsheet you really have to understand what is being said about place in a whole different way than a close reading. So, if you take a sentence like: “He found them a hotel in Rue Lamartine, near Gard du Nord, in Monmatre”. Is that one location or three? The Edinburgh GeoParser maps two points but not Rue Lamartine… So you have to use Google maps for that… And is the accuracy correct. And you have to discuss if those two map points are distorting. The discussion there is more rich than any other discussion you would have around close reading. We are so confident about close readings… We assume it as a research method… This is a different way to close read… To shoe horn into a different structure.
So, I really like Michel De Certeau’s “Spatial stories” in The practice of everyday life (De Certeau 1984), where he talks about structured space and the ambiguous realities of use and engagement in that space. And that’s what that Rue LaMartine type example is all about.
Q&A
Q1) What about looking at distance between points, how length of discussion varies in comparison to real distance
A1) That’s an interesting thing. And that CartoDB Torque display is crude but exciting to me – a great way to explore that sort of question.
OER as Assessment – Stuart Nichol, LTW
I’m going to be talking about OER as Assessment from a students perspective. I study part time on the MSc in Digital Education and a few years ago I took a module called Digital Futures for Learning, a course co-created by participants and where assessment is built around developing an Open Educational Resource. The purpose is to “facilitate learning for the whole group”. This requires a pedagogical approach (to running the module) which is quite structured to enable that flexibility.
So, for this course, the assessment structure is 30% position paper (basis of content for the OER), then 40% of mark for the OER (30%peer-assessed and tutor moderated / 10% self assessed), and then the final 30% of the marks come from an analysis paper that reflects on the peer assessment. You could then resubmit the OER along with that paper reflecting on that process.
I took this module a few years ago, before the University’s adoption of an open educational resource policy, but I was really interested in this. So I ended up building a course on Open Accrediation, and Open Badges, using weebly:
http://openaccreditation.weebly.com/.
This was really useful as a route to learn about Open Educational Resources generally but that artefact has also become part of my professional portfolio now. It’s a really different type of assignment and experience. And, looking at my stats from this site I can see it is still in use, still getting hits. And Hamish (Macleod) points to that course in his Game Based Learning module now. My contact information is on that site and I get tweets and feedback about the resource which is great. It is such a different experience to the traditional essay type idea. And, as a learning technologist, this was quite an authentic experience. The course structure and process felt like professional practice.
This type of process, and use of open assessment, is in use elsewhere. In Geosciences there are undergraduate students working with local schools and preparing open educational resources around that. There are other courses too. We support that with advice on copyright and licensing. There are also real opportunities for this in the SLICCs (Student Led Individually Created Courses). If you are considering going down this route then there is support at the University from the IS OER Service – we have a workshop at KB on 3rd March. We also have the new
Open.Ed website, about Open Educational Resources which has information on workshops, guidance, and showcases of University work as well as blogs from practitioners. And we now have an approved
OER policy for learning and teaching.
In that new OER Policy and how that relates to assessment, and we are clear that OERs are created by both staff and students.
And finally, fresh from the ILW Editathon this week, Ewan MacAndrew, our new Wikimedian in residence, will introduce us to Histropedia (Interactive timelines for Wikipedia:Â
http://histropedia.com) and run through a practical introduction to Wikipedia editing.
Share/Bookmark


 Last week EDINA had the opportunity to take part in the