Data Visualisation with D3 workshop

Last week I attended the 4th HSS Digital Day of Ideas 2015. Amongst networking and some interesting presentations on the use of digital technologies in humanities research (the two presentations I attended focused on analysis and visualisation of historical records), I attended the hands-on `Data Visualisation with D3′ workshop run by Uta Hinrichs, which I thoroughly enjoyed.

The workshop was a crash course to start visualising data combining d3.js and leaflet.js libraries, with HTML, SVG, and CSS. For this, we needed to have installed a text editor (e.g. Notepad++, TextWrangler) and a server environment for local development (e.g. WAMP, MAMP). With the software installed beforehand, I was ready to script as soon as I got there. We were recommended to use Chrome (or Safari), for it seems to work best for JavaScript, and the developer tools it offers are pretty good.

First, we started with the basics of how the d3.js library and other JavaScript libraries, such as jquery or leaflet, are incorporated into basic HTML pages. D3 is an open source library developed by Mike Bostocks. All the ‘visualisation magic’ happens in the browser, which takes the HTML file and processes the scripts as displayed in the console. The data used in the visualisation is pulled into the console, thus you cannot hide the data.

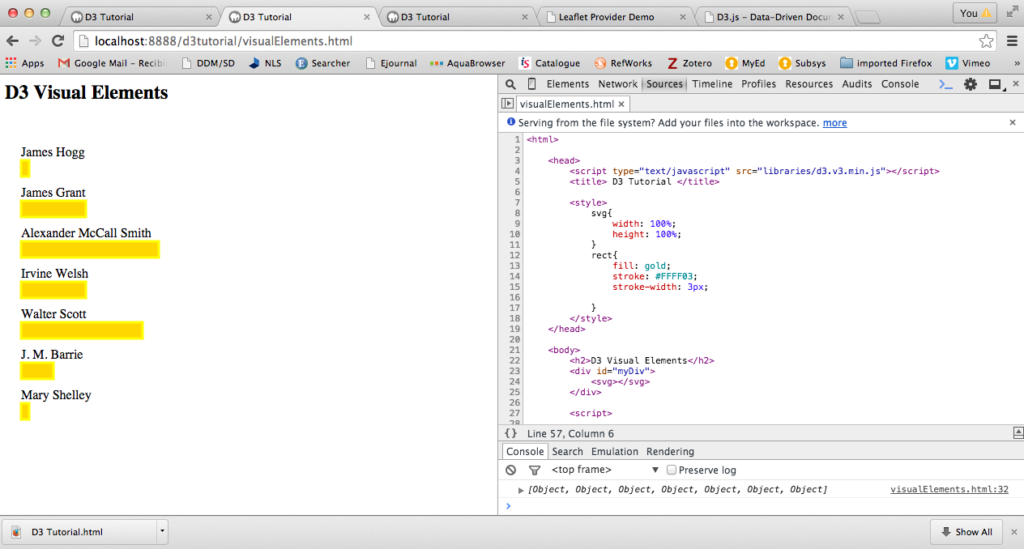
For this visualisation (D3 Visual Elements), the browser uses the content of the HTML file to call the d3.js library and the data into the console. In this example, the HTML contains a bit of CSS and SVG (Scalable Vector Graphics) element with a d3.js script which pulls data from a CSV file containing the details: author and number of books. The visualisation displays the authors’ names and bars representing the number of books each author has written. The bars change colour and display the number of books when you hover over.

Visualising CSV data with D3 JavaScript libary

The second visualisation we worked on was the combination of geo-referenced data and leaflet.js library. Here, we combine the d3.js and leaflet.js libraries to display geographic data from a CSV file. First we ensured the OpenStreetMap loaded, then pulled the CSV data in and last customised the map using a different map tile. We also added data points to the map and pop-up tags.

Visualising CSV data using leaflet JavaScript library

In this 2-hour workshop, Uta Hinrichs managed to give a flavour of the possibilities that JavaScript libraries offer and how ‘relatively easy’ it is to visualise data online.

Workshop links:

Other links:

Rocio von Jungenfeld

EDINA and Data Library

Share

Data: photographs in research

In collaboration with Scholarly Communications, the Data Library participated in the workshop “Data: photographs in research” as part of a series of workshops organised by Dr Tom Allbeson and Dr Ella Chmielewska for the pilot project “Fostering Photographic Research at CHSS” supported by the College of Humanities and Social Science (CHSS) Challenge Investment Fund.

In our research support roles, Theo Andrew and I addressed issues associated with finding and using photographs from repositories, archives and collections, and the challenges of re-using photographs in research publications. Workshop attendants came from a wide range of disciplines, and were at different stages in their research careers.

First, I gave a brief intro on terminology and research data basics, and navigated through media platforms and digital repositories like Jisc Media Hub, VADS, Wellcome Trust, Europeana, Live Art Archive, Flickr Commons, Library of Congress Prints & Photographs Online Catalog (Muybridge http://hdl.loc.gov/loc.pnp/cph.3a45870) – links below.

Eadweard Muybridge. 1878. The Horse in motion. Photograph.

From the Library of Congress Prints and Photographs Online Catalog

Then, Theo presented key concepts of copyright and licensing, which opened up an extensive discussion on what things researchers have to consider when re-using photographs and what institutional support researchers expect to have. Some workshop attendees shared their experience of reusing photographs from collections and archives, and discussed the challenges they face with online publications.

The last presentation tackling the basics of managing photographic research data was not delivered due to time constraints. The presentation was for researchers who produce photographic materials, however, advice on best RDM practice is relevant to any researcher independently of whether they are producing primary data or reusing secondary data. There may be another opportunity to present the remaining slides to CHSS researchers at a future workshop.

ONLINE RESOURCES

LICENSING

Share

New data curation profile in History

Margaret Forrest, Academic Liaison Librarian for the School of History, Classics and Archaeology, is the latest to contribute a data curation profile. She has interviewed researcher Graham J. Black, who is a PhD candidate in the School. His subject is the aerial bombing during the Vietnam War and he has thousands of government documents, articles and pictures to manage.

The profile has been added to previous ones on the DIY RDM Training Kit for Librarians web page created by other librarians participating in the RDM librarian training. The librarians covered five RDM topics in separate two-hour sessions,where they reinforced what was learned in MANTRA through group discussion, exercises from the UK Data Archive, and listening to local experts.

Each librarian was encouraged to complete an independent study as part of the training: interview a researcher and write up a data curation profile. This was designed to test their self-confidence at talking to researchers about RDM, as well as give them the opportunity to ‘share their data’ by publishing the profile on the website.

Margaret described her experience to Anne Donnelly, one of the trainers:

This was definitely the most enjoyable part of the training and I learned so much from this interview process and the writing up (mainly because of the value of what I had learned from the MANTRA course).

The final group of eight academic service librarians completed their training this summer. This completes a deliverable in the University’s RDM Roadmap. More curation profiles are welcome; we may put them in a collection in Edinburgh DataShare. They could be useful learning objects for others doing training in research data support, in terms of thinking critically about RDM practices.

Robin Rice
Data Librarian

Share