Last week I attended the 4th HSS Digital Day of Ideas 2015. Amongst networking and some interesting presentations on the use of digital technologies in humanities research (the two presentations I attended focused on analysis and visualisation of historical records), I attended the hands-on `Data Visualisation with D3′ workshop run by Uta Hinrichs, which I thoroughly enjoyed.
The workshop was a crash course to start visualising data combining d3.js and leaflet.js libraries, with HTML, SVG, and CSS. For this, we needed to have installed a text editor (e.g. Notepad++, TextWrangler) and a server environment for local development (e.g. WAMP, MAMP). With the software installed beforehand, I was ready to script as soon as I got there. We were recommended to use Chrome (or Safari), for it seems to work best for JavaScript, and the developer tools it offers are pretty good.
First, we started with the basics of how the d3.js library and other JavaScript libraries, such as jquery or leaflet, are incorporated into basic HTML pages. D3 is an open source library developed by Mike Bostocks. All the ‘visualisation magic’ happens in the browser, which takes the HTML file and processes the scripts as displayed in the console. The data used in the visualisation is pulled into the console, thus you cannot hide the data.
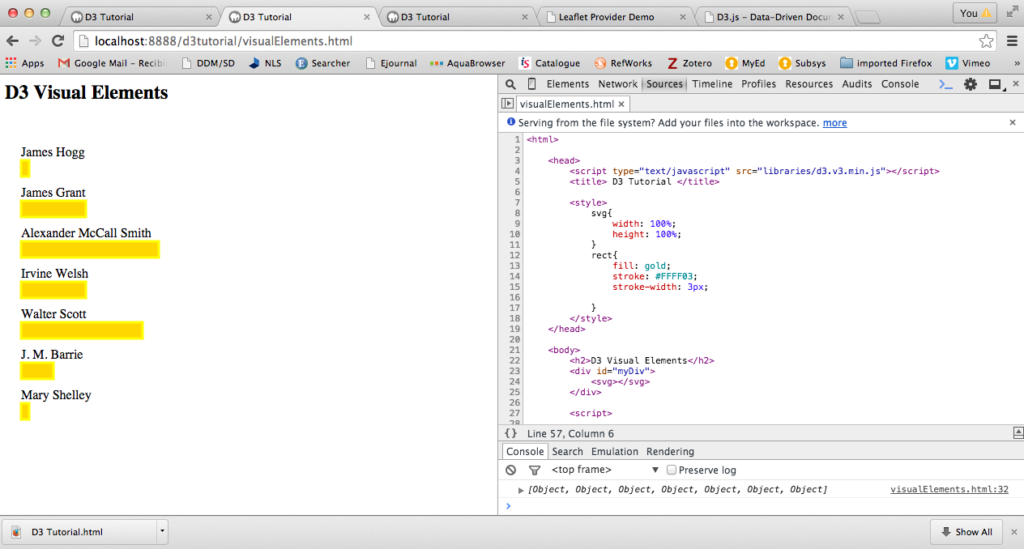
For this visualisation (D3 Visual Elements), the browser uses the content of the HTML file to call the d3.js library and the data into the console. In this example, the HTML contains a bit of CSS and SVG (Scalable Vector Graphics) element with a d3.js script which pulls data from a CSV file containing the details: author and number of books. The visualisation displays the authors’ names and bars representing the number of books each author has written. The bars change colour and display the number of books when you hover over.
The second visualisation we worked on was the combination of geo-referenced data and leaflet.js library. Here, we combine the d3.js and leaflet.js libraries to display geographic data from a CSV file. First we ensured the OpenStreetMap loaded, then pulled the CSV data in and last customised the map using a different map tile. We also added data points to the map and pop-up tags.
In this 2-hour workshop, Uta Hinrichs managed to give a flavour of the possibilities that JavaScript libraries offer and how ‘relatively easy’ it is to visualise data online.
Workshop links:
- Visualising data with D3 workshop – http://www.digital.hss.ed.ac.uk/news/digital-day-of-ideas-2015/uta-hinrichs/
- Dr Uta Hinrichs (St Andrews University) – http://www.utahinrichs.de/
- D3 website (find out all about D3) – http://d3js.org/
- Mike Bostocks’s website – http://bost.ocks.org/mike/
- Github D3 gallery – https://github.com/mbostock/d3/wiki/Gallery
Other links:
- Digital Scholarship website – http://www.digital.hss.ed.ac.uk/
- Lorna E. Campbell’s blog post about the event – https://lornamcampbell.wordpress.com/2015/05/29/day-of-digital-ideas-2015/
Rocio von Jungenfeld
EDINA and Data Library


