
On Thursday 17th and Friday 18th May we held a Trading Consequences project meeting in Edinburgh where the whole team finally got to meet each other after months of virtual meetings. Here are the 10 awesome things we found out…
- Visualisation isn’t about pretty pictures it’s about insight. Take for example the London Underground map and a New York Subway map… you will see some seriously different stylings (you can see both in Aaron’s presentation here). The London Underground Map is all about key points on the routes, the map isn’t a literal representation of distance but a conceptual take on London’s origins as a network of villages. In New York, where residents are used to walking above ground and are particularly used to the grid system for roads the map reflects this in order to make it easier to conceptualise the combination of Subway and walking routes. And that’s the key thing… visualisations are about representing different world views, different conceptions of information, specific mental maps of the data. A good visualisation reflects a particular world view rather than trying to loyally mirror reality.
-
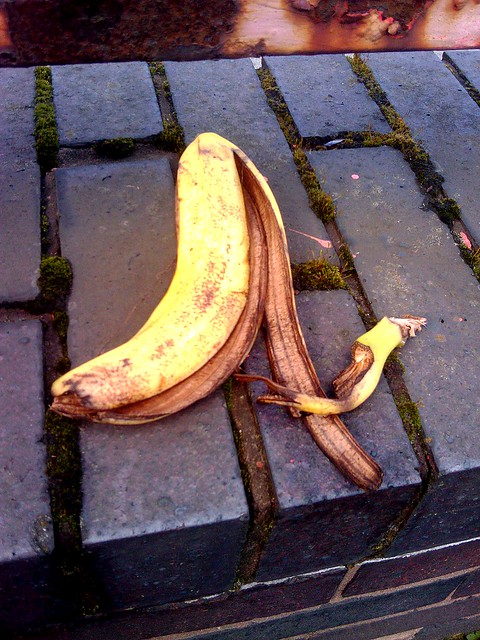
Moved banana by Flickr user ungard | dave ungar
Yes, we have no bananas! Well, actually, we might have some bananas today but in London in 1905 did you know that you were allowed to steal bananas if they were brown or blackened? There is an oral history description of being allowed to steal these bananas as they couldn’t be sold. So, can we find evidence to back this up? If we are going to then we need to leave as much information in the ontology we are building to ensure we can find and access that sort of detail. Of course we know what we want to look for here – banana-bread ready fruit is a bit of a known unknown – but what about the things we don’t know about yet? The unknown unknowns we may want to find in the future? Not being able to find something in the data we have gathered doesn’t necessarily mean it’s not there, it just means we can’t confirm that it’s there.
- The 19th Century take on “animal, vegetable, or mineral?”… was “from the sea“, “from the farm“, or “from the forest”? This is all about ontologies again… So what is an ontology? Well it’s a way to understand the world, a conceptual model that allows you to structure, sort, classify, connect and understand each item within its immediate and wider context. In an era of trading raw materials and early manufactured items “from the sea” made sense, “from the farm” added useful context… similarly we might be used to understanding trees by their genus but historically qualities such as whether it can be sawn or hewn were important classifications. We’ve been thinking about this since the meeting and you can read about some of the issues around ontologies on Ewan’s blog.
-
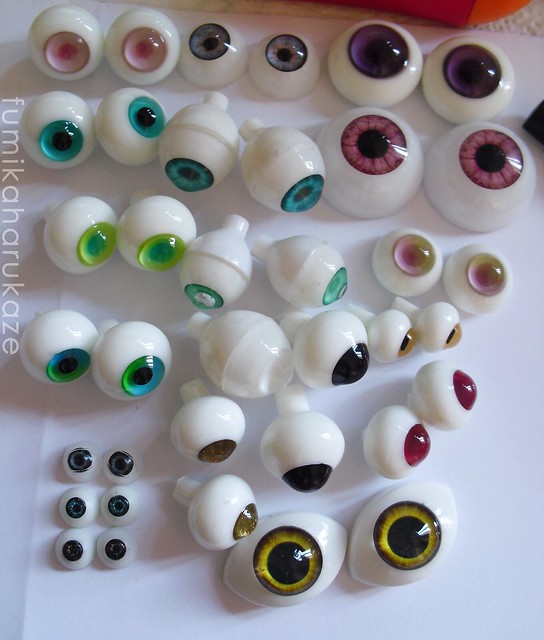
Eyes (NOT FOR SALE) by Flickr User fumikaharukaze | Fumika Harukaze
The eyes have it… and that can be a real problem as us humans are quite a lot better built for reading visual information than machines. When we are looking at sources for Trading Consequences we are seeing digitised materials that have been scanned then OCRed (put through Optical Character Recognition). Printing presses used to be pretty quirky – the letter “a” might look squiffy in every print, or a mark might appear on every page, ink may have smudged, etc. Scanning and OCR technology might look much more high tech but they too have quirks – digital cameras and scanners get better all the time and OCR engines improve each year… that means materials we are working with that were digitised years back look noticibly different from those that have been recently scanned and OCRed. That can be pretty challenging… and then we get to the many tables of traded goods. The human may see a very attractive pattern of columns and rows but the computer just doesn’t see it that easily and we have to try to guide it to read the data in so that it makes sense to the machine, to us humans, and that it reflects what was in the original document.
-

"Turkey red floral patterns." by the National Museum of Scotland's Feastbowl Blog (click through to read a full post on Turkey Red)
Wild turkey and rubber demands…. Turkey Red is a type of dyed cotton – named after the place not the bird – which was exported in huge amounts, much of it from Aberdeen. But Turkey Red was a complicated and expensive die to make and the process was incompatible with the new textile printing processes that were emerging. There was a shift from natural dyes to synthetic materials and demand for Turkey Red plummeted. The project team has been in discussion with Edinburgh University’s Stana Nenadic and her Colouring the Nation project, which specifically looks at the history of Turkey Red. However, this is just one great example of changes in society being echoed by the consequence of trade and we hope this project will help us explore more of these Big changes generally take place at key pivotal dates due to shifts in economic, political and environmental factors and historians will look for these peaks and sharp changes. Changes such a huge increase in demand for rubber because of the bicycle craze!
- Lost in translation? With academic historians, informatics researchers, visualisation experts, specialists in geospatially enabled databases and a social media specialist gathered together in one small room with a lot of coffee we knew we’d have to do a lot of talking to explain our very different positions. For a start our informatics researchers are used to beginning with a hypothesis whilst our historical researchers are much more likely to take a grounded research approach. This is a really different way to plan and conduct work and we need to understand where we’re all coming from. The tools this project creates need to enable historians in their processes and we must be careful to build something that meets specific needs and appropriate expectations. At the same time, as a project team, we also need to be working together to ensure our publications schedules make sense so we needed to spend some time getting up to speed on which conferences matter in each discipline, where we can work collaboratively on papers and publications, and what types of research outputs are most important for the project partners.
-
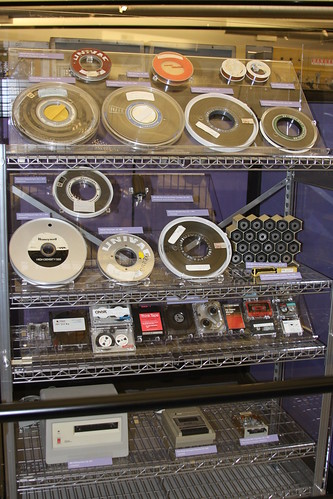
The History of Tape Storage by Flickr user Pargon
Storage solutions: a database is not just “a database”, just like furniture from a certain Swedish home furnishing chain you need to know the measurements, the aesthetic needs, the future extensibility before you buy. And just like a house you need the right foundations to build something stable, fit for purpose and ready to use. What questions we will be asking of our data are the essential starting point here (see also Aaron’s blog, “The question is key in Trading Consequences” ) – knowing these and some sort of suitable ontology early on helps us ensure we can design the right structure for our database.
- History in a changeable climate – part of the the Trading Consequences project is to consider the impact, the consequences, of historical trades. That means looking at different resources and seeing what the most likely environmental impacts of timber trade, cattle trade and so on might be. That means users may want to query our data based on those impact – looking up the kind of trades that might contribute to flooding, that may be reflected in famine, that might be affected by draught, etc. That requires a whole separate ontology for environmental impact that can somehow account for these very interconnected factors – and that is a lot harder than it looks!
-
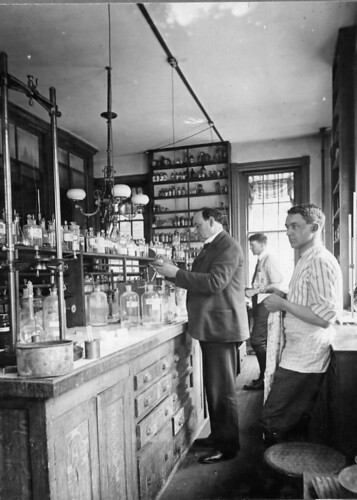
Harvey W. Wiley conducting experiments in his laboratory by DC Public Library Commons | DCPL Commons on Flickr Commons (click for more information)
Shipping drugs – no, not a sinister diversification for the project but a reflection of the complexity of trading data. We can look for records of trading particular types of medicines and drugs but sometimes that’s not the right data to look at. Botanical trades also reflects the trading of drugs as some plant material was shipped for later use or processing into pharmaceuticals (for an idea of the type of plants involved take a look at the Alnwick Poison Garden). The same issue applies to leather goods for instance – you might trade the hides, specific goods like leather gloves, perhaps even the whole cow. All of those trades may reflect leather trade but understanding, combining and querying that data poses some challenges.
- Pithy headings! They matter! Part of our project meeting was considering how we communicate the project. As well as learning to use pithy headings, images, bullet points and other web-friendly formatting, we also found out that blog posts should usually be no more than 200-300 words. We also discussed how people access this site on other devices, particularly mobiles. Although we are working on historical data a lot of us are using smart phones and they have smaller screens and differing requirements. We agreed to apply a new mobile theme – so do try reading this blog on your phone and let us know if you like it!
We hope that gave you a flavour of our kick off meeting. It took place over two days so we’ve obviously trimmed it down a lot but if you have any questions, comments or suggestions do add it here and we’ll get back to you.
![]()